Open-Source Watershed Science
The Challenge
Governments, First Nations, non-profits, and stewardship organizations across British Columbia need reliable ways to understand their watersheds — whether they're planning restoration, assessing fish habitat, monitoring water quality, or responding to climate-driven changes. But the technical barriers are high. Critical information remains scattered across provincial databases, historic archives, and specialized models — difficult to assemble, and hard for the people responsible for a watershed to keep hold of between projects. Our answer is open data, open tools, and field teams who can use them.
Who We Are
Our work combines field biology, spatial data science, and software development to facilitate aquatic ecosystem conservation and restoration — with an emphasis on inclusive engagement and knowledge sharing.
We work alongside stewardship organizations, First Nations and agencies across BC. The work is stream network modelling, floodplain analysis, land cover change detection, nutrient loading, aquatic health monitoring, field programs and interactive online reporting, connected so that provincial data, analysis, field collection and reporting are one workflow.
Our Approach
We understand our well-being as inseparable from the health of the land and waters we work within. When we care for ecosystems, we care for ourselves.
We work in the open because shared methods, shared tools, and shared findings are how we move the needle faster — on conservation and restoration, on understanding, on justice for the places and people we care about.
Our analytical tools, data, and methods are publicly available — so every project strengthens shared tools, and every partnership compounds across watersheds and years.
How It Works
Four questions about a watershed. Open data catalogues feed the analysis, and the analysis becomes the field maps crews carry and the reports partners read.
Where is the habitat, and what's keeping fish from it?
Habitat potential for each species, whether fish can reach it, and which barrier is in the way. The habitat models can be tuned and tested against where fish have actually been found. Flow for almost every stream, and water temperature at gauging stations, round out the picture.
Where is the floodplain, what did it look like before, and what has changed?
Where the floodplain is, and where roads, rail and fill may cut the river off from it. Historic airphotos show earlier conditions to compare against. Land-cover change can be mapped between any two years the satellite land-cover maps cover and tagged with any mapped area it overlaps, such as fire perimeters or cutblocks. Climate departure shows how far conditions have moved from normal. Together they are a screening map of where to look.
What do the ground and water look like now?
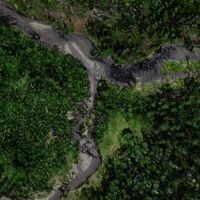
Open catalogues of provincial lidar and drone imagery from our programs, searchable by place, and the water temperature, flow and level records from stream gauges, ready to query. We built them so this data can be found and loaded straight into models, field maps and reports.

Into the field and back
We take the planning into the field, with a custom field system for each program: map projects and digital forms that work offline. We build the capacity of field teams to navigate, collect and interpret data. What they collect flows back into the models, and the reports rebuild when new data arrives.
What This Looks Like in Practice
Long-term programs that use these tools today: delivering reports, building field capacity, and improving the tools with every season.
Watershed Restoration & Conservation
Aquatic restoration planning, delivery and monitoring across British Columbia — from the Neexdzii Kwah watershed restoration framework to fish passage assessment across the Skeena, Peace and Fraser regions and the Elk River.
Explore →Aquatic Monitoring & Assessment
Nutrient loading analysis for Kootenay Lake and Arrow Lakes Reservoir. Benthic community health assessment. Kokanee stock assessment. Decades of monitoring data integrated into reproducible workflows.
Explore →Open Source Software
Habitat potential and access for each species, floodplains and how they have changed, and open catalogues of lidar, drone imagery and stream data, with the code to build them. Each partnership extends them. Built in the open wherever transparency improves science.
Explore →Our analytical tools and methods are public. Transparent, reproducible, and built to share.
VIEW ON GITHUB