Open Source Software Development
Our data, analytical tools, and methods are publicly available on GitHub — built in R, Python, SQL, shell, OpenTofu, and GitHub Actions. We work in the open wherever transparency improves science. The packages highlighted here are designed to work together — field data (observations, eDNA, barriers) and stream measurements (temperature, channel width, climate) feed fresh and link, which produce habitat and connectivity models for the watershed. Those outputs then drive floodplain delineation, land cover change detection, and climate analysis, all rendered as interactive reports and print-ready PDFs.
Watershed Modelling
Composable tools for understanding watersheds — per-species habitat classification, connectivity modelling, barrier interpretation, floodplain delineation, land cover change, historic condition, and climate trends. Built on the Freshwater Atlas, portable to any stream network.

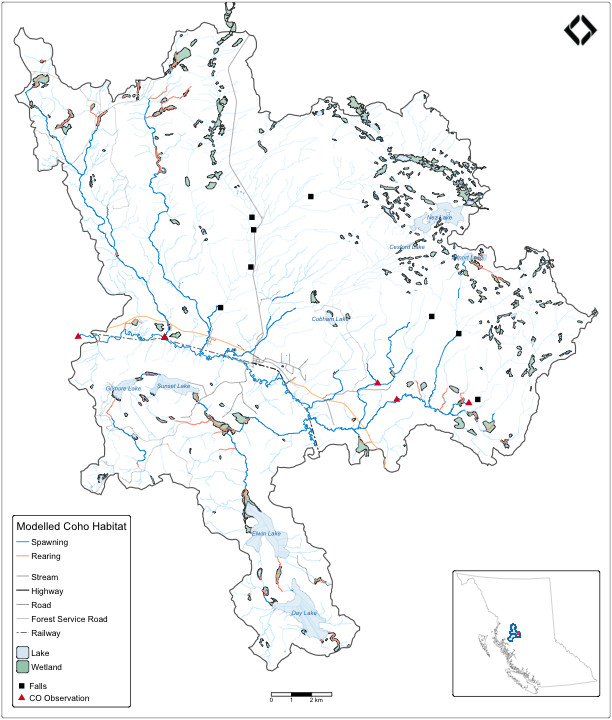
fresh — Freshwater Referenced Spatial Hydrology
A stream network modelling engine. Classify habitat for any species using any measurable stream attribute — gradient, channel width, temperature, discharge, climate departures — break the network at barriers or falls, and summarise habitat upstream or downstream of any point on the network.
Running on BC’s Freshwater Atlas today, designed to work on any stream network — other provincial atlases, LiDAR-derived networks from our STAC DEM catalogue, or streams in other jurisdictions.

link — Watershed Point Interpretation
Connects field data to the stream network and interprets what it means. Load, match, and score any point data — fish-passage barriers, observations, eDNA detections, density samples, thermal loggers, water quality stations, traditional use locations — and track where each record came from and how it was corrected.
Feeds fresh the break points and barrier lists it needs to classify habitat, and reads fresh’s output back to summarise habitat above each field site.

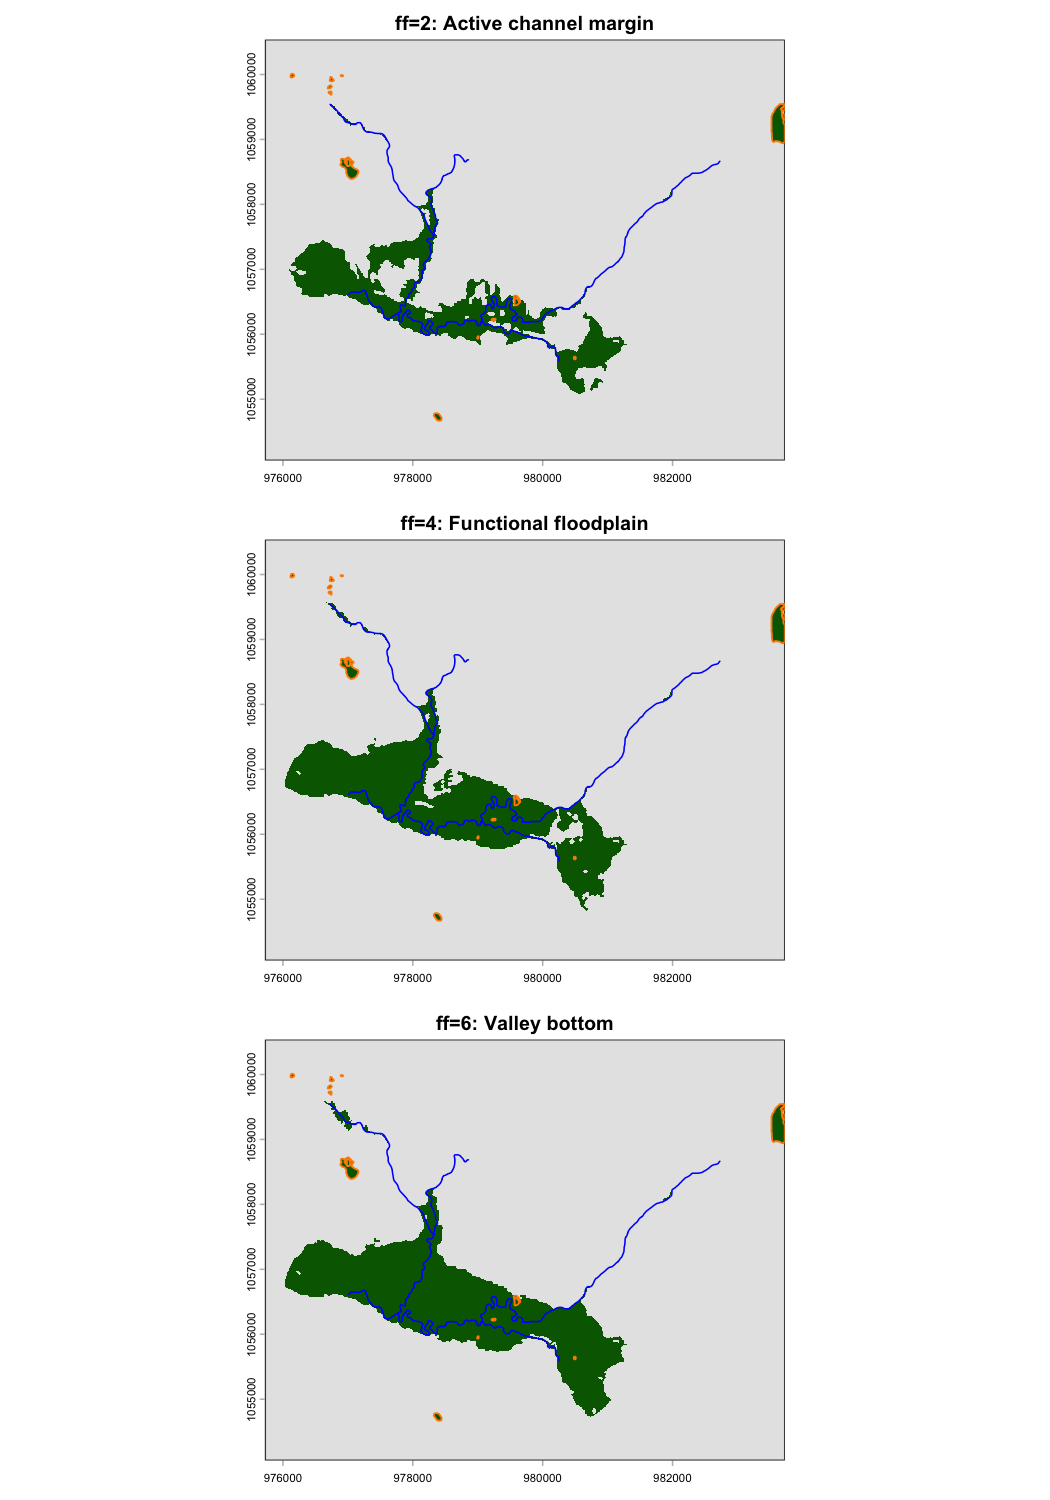
flooded — Floodplain Delineation
Delineate functional floodplains from any elevation model and stream network using the Valley Confinement Algorithm — slope thresholding, cost-distance analysis, and flood-surface modelling with a bankfull regression. Works with any elevation source, from provincial TRIM to 1 m LiDAR from our STAC DEM catalogue.
The difference between coarse and fine elevation data is itself a diagnostic. Coarse data shows the floodplain surface; fine-resolution LiDAR exposes the roads, rail grades, dykes, and agricultural fill that sit above that surface and block lateral connectivity. Comparing the two shows what is preventing floodplain from functioning, and where to act — fill removal, dyke breaches, crossing installations.
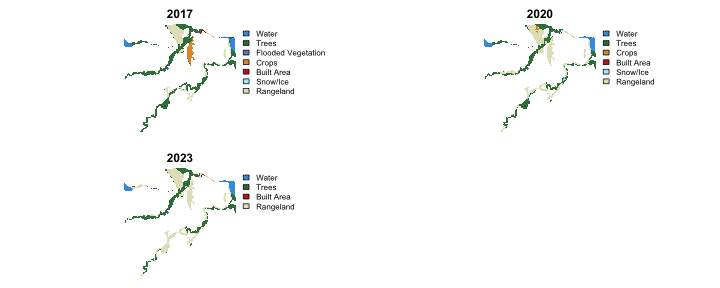
drift — Detecting Riparian and Inland Floodplain Transitions
Fetch classified land cover rasters from STAC catalogs — Esri IO LULC, ESA WorldCover, or custom sources — apply class labels and colours, and summarise area change over time. Works at global satellite resolution (10 m IO LULC) or the sub-metre UAV classifications from our stac_uav_bc catalogue.
Queries crop the data before download, not after — so province-scale areas of interest do not require full-tile fetches. Interactive tiles are served through titiler for on-the-fly visualisation of massive rasters. Pair with flooded for within-floodplain analysis, or use on its own for any area of interest.

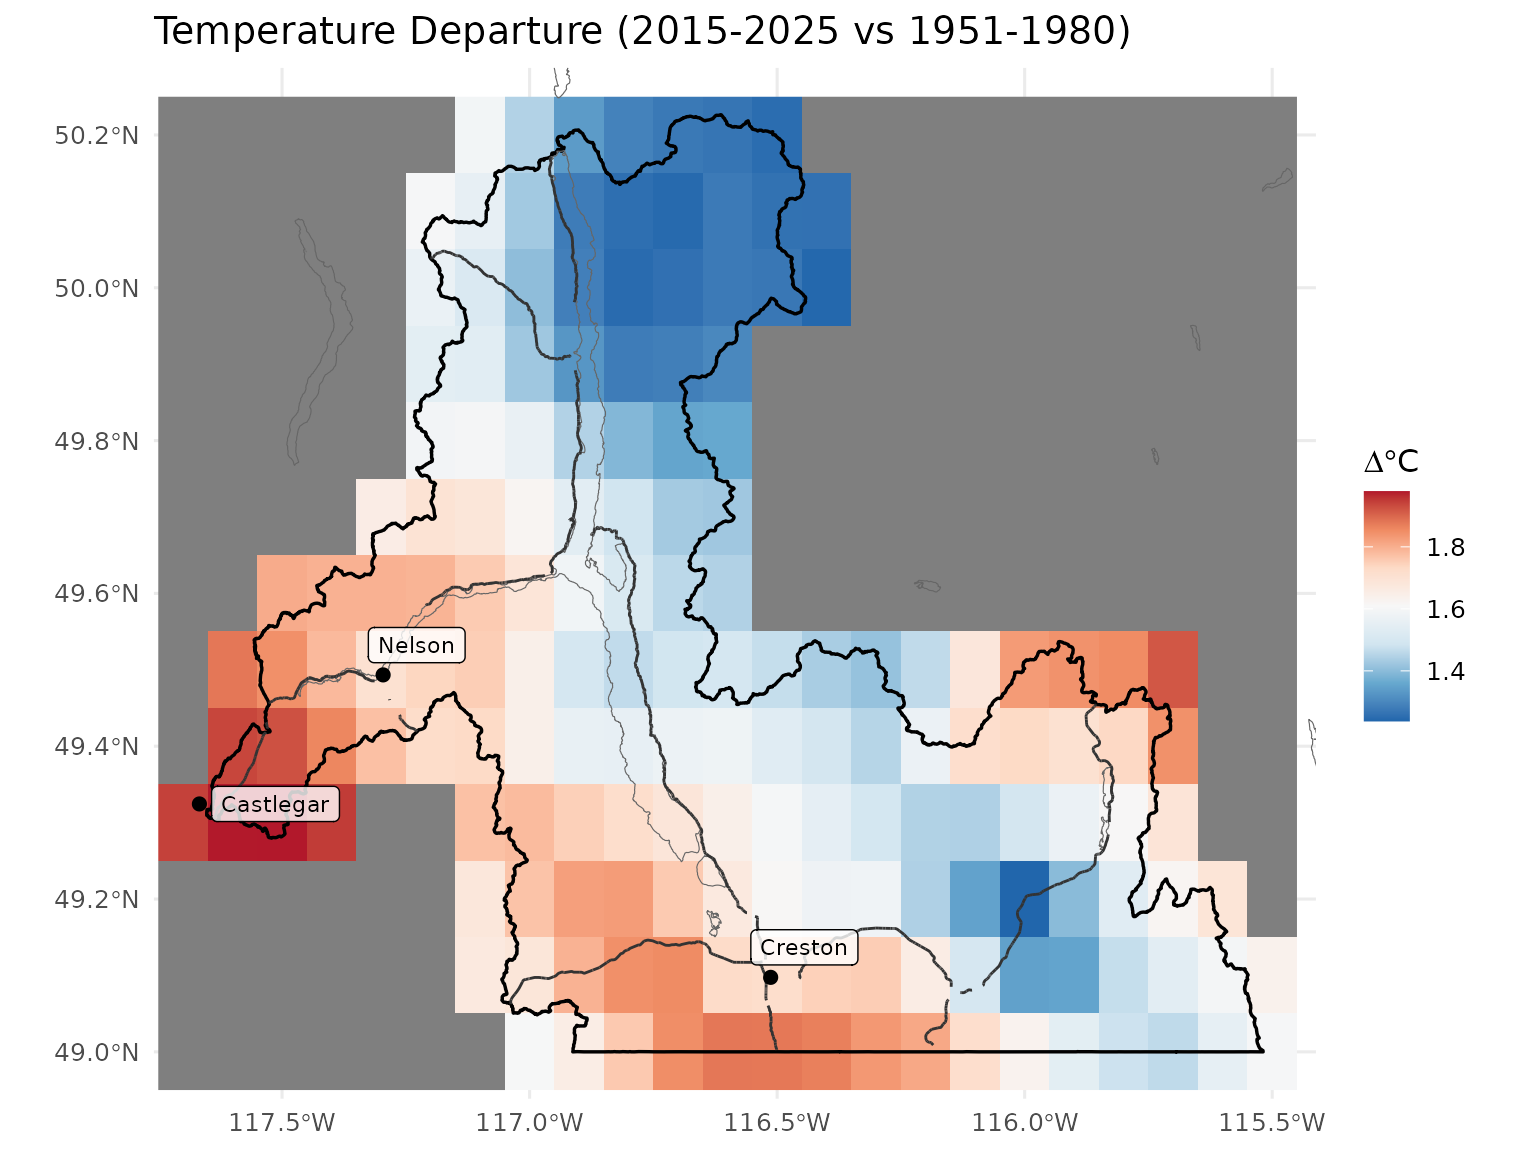
cd — Climate Departure
Climate departure analysis from ERA5-Land reanalysis data. Derive temperature, precipitation, vapour pressure deficit, and soil moisture trends for any watershed. Served as cloud-hosted catalogs for integration with other pipelines.

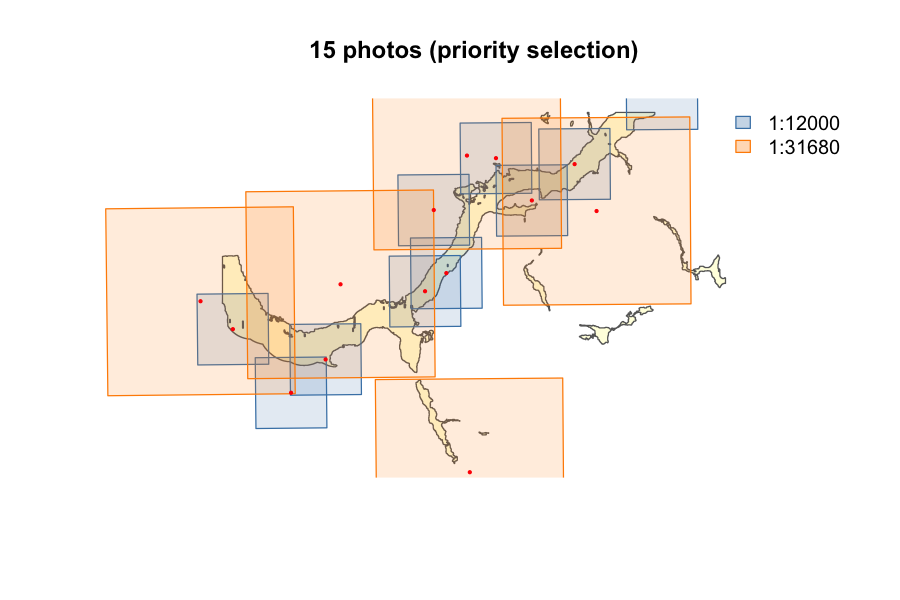
fly — Airphoto Retrieval and Coverage Selection
Download and georeference historic airphotos, estimate ground footprints from centroids and film scale, compute coverage over areas of interest, and select minimum photo sets. Visualize past watershed conditions from decades of provincial aerial photography — the ground truth behind satellite-derived change detection. Outputs feed into stac_airphoto_bc for cataloging.
Spatial Data Infrastructure
Provincial-scale imagery, elevation data, and stream temperature records — catalogued and queryable from R, QGIS, and Python. Cloud-hosted tile serving for on-the-fly visualization of massive rasters.
| Collection | Content | Scale |
|---|---|---|
| stac_dem_bc | LiDAR elevation models | 50,000+ tiles, province-wide |
| stac_airphoto_bc | Historic aerial photographs (1963–2019) | Growing, ~10,000 georeferenced thumbnails |
| stac_orthophoto_bc | Provincial orthophoto collection | Province-wide |
| stac_uav_bc | Drone imagery by watershed | Project-based, growing |
| water-temp-bc | Stream temperature from federal hydrometric stations | Province-wide, cloud-hosted |
water-temp-bc — Stream Temperature Data
Stream temperature records from federal hydrometric stations across BC — scraped from Environment and Climate Change Canada’s real-time web service and combined with historic data extracts. Served as cloud-hosted files queryable from R without a database.
This data feeds into collaborative science with Poisson Consulting and Hillcrest Geographics that is advancing fish habitat modelling across the province — spatial stream network temperature modelling ( Skeena 2025, Nechako 2022) and channel width regression models that integrate with fresh and link for habitat classification.
Field-to-Report Workflows
We assemble reproducible, field-ready GIS projects for any watershed in British Columbia. Provincial datasets from the BC Data Catalogue, Freshwater Atlas, and our cloud-hosted layers are pulled, clipped to project boundaries, and delivered as fully styled QGIS projects with digital field forms — ready to deploy to mobile devices for collaborative offline collection.
We maintain forms for fish passage assessment, habitat confirmation, effectiveness monitoring, restoration site investigation, eDNA sampling, and benthic invertebrate collection, and add new ones as programs evolve. Where possible, collected data is structured for direct submission to provincial database systems (FISS, PSCIS, CABIN); other data lands in central database systems we maintain and share with partners. Photos are automatically renamed and organized into site directories. Multiple team members contribute within the same shared project, with changes syncing between field and office.
Collected data flows back into the same pipeline it came from — fish passage assessments feed into link’s barrier scoring; eDNA detections and benthic samples become new records on the stream network; habitat confirmations replace modelled classifications with field-verified ones. Field → network → report, closed loop.
Dynamic Reporting
We pioneered interactive, version-controlled environmental reporting in British Columbia. One set of source files produces both an interactive online report and a print-ready PDF — complete with maps, figures, tables, cross-references, and citations. When new data arrives or methods are refined, the report rebuilds. Every analysis is reproducible, every change is tracked, and every report is publicly accessible.
This approach has produced hundreds of deliverables across fish passage, restoration planning, nutrient loading, and aquatic assessment programs. See live examples in our Watershed Restoration & Conservation and Aquatic Monitoring & Assessment work.
- Posted on:
- January 1, 0001
- Length:
- 5 minute read, 1028 words
- See Also: