Fern Creek - 125261 - Appendix
Site Location
PSCIS crossing 125261 is located on Fern Creek near the 2.1km mark of the Chuchinka-Table FSR approximately 300m upstream from the confluence with the Parsnip River. Canfor Corporation are forest licensees within the watershed with the Ministry of Forests as the road tenure holder.
Background
The site was originally prioritized for replacement through this project in 2022 – 2023, following a habitat confirmation assessment documented in the 2022 report (A. Irvine and Wintersheidt 2023). Follow-up work in 2023 included fish sampling, Passive Integrated Transponders (PIT) tagging, and aerial surveys, included in this memo. The site was revisited in the summer of 2024 to conduct additional fish sampling and PIT tagging, and to see whether any individuals tagged during the 2023 field season were recaptured. Originally drafted to document 2022 – 2023 field activities, this memo was updated in 2025 to include PIT tagging and fish sampling results from 2024, with ongoing revisions tracked here.
At crossing 125261, is a fourth order stream with a watershed area upstream of the crossing of approximately 23.5km2. The elevation of the watershed ranges from a maximum of 1137m to 730m near the crossing (Table 5.8). Fish species confirmed upstream of the FSR include burbot, rainbow trout, bull trout, sucker, reside shiner, dace and chub (Norris [2018] 2024; MoE 2024). A total of 148ha of lake and 37ha of wetland are modelled upstream. This includes Fern Lakes, a collection of three lakes that have a combined area of approximately 138ha. The outlet of the first lake in the chain is 3.3km upstream of the FSR.
Metal baffles - historically installed within the structure - indicate that there have been fish passage restoration efforts at this crossing in the past. The pipe appears undersized for the crossing, indicated by downcutting at the outlet and high flow velocities within the structure. Flows appear to be too high for the baffles to retain substrate and function effectively. Although larger fish are likely able to ascend through the crossing (depending on size of the fish, swimming ability and flow levels at the time of upstream migration) the crossing is still considered a barrier to fish passage and likely blocks migration of all juvenile life stages at all flows. Crossing characteristics are described in detail in the 2022 report (A. Irvine and Wintersheidt 2023).
Canfor procured preliminary engineering designs for a replacement clear-span bridge structure for crossing 125261 through internal Canfor funding. The preliminary design can be viewed and downloaded from here. The cost of replacement was estimated at $430,000 however this figure can be considered preliminary and subject to change.
A summary of habitat modelling outputs is presented in Table 5.9. A map of the watershed is provided in map attachment 093J.119.
fpr::fpr_table_wshd_sum(site_id = my_site) |>
  fpr::fpr_kable(caption_text = paste0('Summary of derived upstream watershed statistics for PSCIS crossing ', my_site, '.'),
           footnote_text = 'Elev P60 = Elevation at which 60% of the watershed area is above',
scroll = F)| Site | Area Km | Elev Site | Elev Max | Elev Median | Elev P60 | Aspect |
|---|---|---|---|---|---|---|
| 125261 | 23.5 | 730 | 1137 | 844 | 835 | SSW |
| * Elev P60 = Elevation at which 60% of the watershed area is above |
| Habitat | Potential | Remediation Gain | Remediation Gain (%) |
|---|---|---|---|
| BT Rearing (km) | 14.4 | 2.7 | 19 |
| BT Spawning (km) | 4.3 | 2.7 | 63 |
| BT Network (km) | 48.3 | 6.9 | 14 |
| BT Stream (km) | 38.4 | 6.0 | 16 |
| BT Lake Reservoir (ha) | 148.1 | 0.0 | 0 |
| BT Wetland (ha) | 36.6 | 14.9 | 41 |
| BT Slopeclass03 (km) | 7.2 | 2.7 | 38 |
| BT Slopeclass05 (km) | 14.9 | 1.3 | 9 |
| BT Slopeclass08 (km) | 3.9 | 1.0 | 26 |
| BT Slopeclass15 (km) | 11.5 | 1.1 | 10 |
| * Model data is preliminary and subject to adjustments. |
Aerial Imagery
During the 2023 site visit, an survey was conducted with a remotely piloted aircraft with resulting images stitched into an orthomosaic presented in Figures 5.12 - 5.13.
model_url <- '<iframe src="https://www.mapsmadeeasy.com/maps/public/1237da97892043aaabca5bed64336ef9" scrolling="no" title="Maps Made Easy" width="100%" height="600" frameBorder ="0"></iframe>'

knitr::asis_output(model_url)
my_photo = 'fig/pixel.png'
my_caption = paste0('Orthomosaic of PSCIS crossing 125261 on Fern Creek before replacement.')
knitr::include_graphics(my_photo, dpi = NA)Figure 5.12: Orthomosaic of PSCIS crossing 125261 on Fern Creek before replacement.
model_url <- '<iframe src="https://www.mapsmadeeasy.com/maps/public_3D/1237da97892043aaabca5bed64336ef9" scrolling="no" title="Maps Made Easy" width="100%" height="500" frameBorder ="0"></iframe>'

knitr::asis_output(model_url)
my_photo = 'fig/pixel.png'
my_caption = paste0('3D model of PSCIS crossing 125261 on Fern Creek before replacement.')
knitr::include_graphics(my_photo, dpi = NA)Figure 5.13: 3D model of PSCIS crossing 125261 on Fern Creek before replacement.
Fish Sampling
In 2023, a total of six sites were sampled in the vicinity of crossing 125261, with three sites located downstream and three sites located upstream of the Chuckinka–Table FSR. Electrofishing results are summarised in Tables 5.10 – 5.11 and Figure 5.14. A total of 37 fish were captured downstream, and 48 were captured upstream. The downstream species assemblage was more diverse, including rainbow trout, sculpin, burbot, and suckers. Upstream fish included primarily rainbow trout with some sculpin (Figures 5.16 – 5.19). Length and weight were collected for all fish captured. Rainbow trout and burbot with a fork length greater than 60mm were tagged with PIT tags (Figures 5.20 – 5.21). Data collected can be accessed here.
In 2024, electrofishing was conducted at two sites downstream and two sites upstream of the Chuckinka–Table FSR, covering approximately the same stream sections sampled in 2023. No PIT tags were detected in the fish captured, indicating that none of the individuals tagged in 2023 were recaptured. Electrofishing results are summarised in Tables 5.12 – 5.13 and Figure 5.15. A total of 36 fish were captured downstream, including rainbow trout and sculpin, and 41 were captured upstream, also consisting of rainbow trout and sculpin (Figures 5.22 - 5.23). All fish captured with a fork length greater than 60mm were tagged with PIT tags, with data stored here.
# species captured downstream
tab_fish_summary_2024 |>
  dplyr::filter(site_id == paste0(my_site, '_ds')) |>
  dplyr::group_by(site_id) |>
  dplyr::distinct(species) |>
  dplyr::pull(species)

# species captured upstream
tab_fish_summary_2024 |>
  dplyr::filter(site_id == paste0(my_site, '_us')) |>
  dplyr::group_by(site_id) |>
  dplyr::distinct(species) |>
  dplyr::pull(species)
Conclusion
Replacement of PSCIS crossing 125261 on Fern Creek is a high priority in this project, as it is a large system likely containing no other anthropogenic obstructions to fish passage. The presence of burbot in the system is of particular interest, as this fish provides good food values and, in general, is considered a weaker swimmer compared to numerous other species (ex. steelhead and coho) based on time-to-fatigue versus swim speed metrics (Katopodis and Gervais 2016). The presence of burbot downstream of the crossing and absence in upstream sample sites could indicate that the crossing is limiting upstream movement for this species; however, sample areas were small and habitat availability/quality may also explain the observed distribution.
In 2024, no PIT tags were detected in the fish captured, indicating that none of the individuals tagged in 2023 were recaptured. Continued fish sampling and PIT tagging will help build understanding of fish movement and health at the site, contributing to long-term effectiveness monitoring. Additionally, aerial imagery and 3D models can be used to track changes in stream morphology and assess the effectiveness of environmental management plans and site rehabilitation following construction.
Replacement of the crossing was tentatively scheduled for 2025; however, due to uncertainties related to timber extraction in the greater Table River watershed, Canfor has expressed uncertainty around the timeline for replacement. Despite this, they have procured preliminary engineering designs for a replacement clear-span bridge structure. Restoration of fish passage at Fern Creek remains a priority for this project, and options to move forward — including securing additional funding from other sources — will continue to be explored.
# Run manually so we can add date into the table caption.
# fpr_table_fish_site()

tab_fish_sites_sum %>%
    tidyr::separate(site, into = c('site_id', 'location', 'ef'), remove = F) %>%
    dplyr::filter(site_id == my_site) %>%
    dplyr::select(site, passes, ef_length_m, ef_width_m, area_m2, enclosure) %>%
fpr_kable(caption_text = paste0('Fish sampling site summary for PSCIS crossing ', my_site, ' in 2023.'), scroll = F)| site | passes | ef_length_m | ef_width_m | area_m2 | enclosure |
|---|---|---|---|---|---|
| 125261_ds_ef1 | 1 | 21 | 4.3 | 90.3 | open |
| 125261_ds_ef2 | 1 | 35 | 3.5 | 122.5 | open |
| 125261_ds_ef3 | 1 | 14 | 2.8 | 39.2 | open |
| 125261_us_ef1 | 1 | 13 | 3.8 | 49.4 | open |
| 125261_us_ef2 | 1 | 18 | 2.4 | 43.2 | open |
| 125261_us_ef3 | 1 | 16 | 4.3 | 68.8 | open |
# Run manually so we can add date into the table caption.
# fpr_table_fish_density()

fish_abund %>%
    dplyr::filter(site == my_site) %>%
    dplyr::select(
      local_name,
      species_code,
      life_stage,
      catch,
      density_100m2,
      nfc_pass) %>%
    fpr_kable(caption_text = paste0('Fish sampling density results summary for PSCIS crossing ', my_site, ' in 2023.'),
              footnote_text = 'nfc_pass FALSE means fish were captured in final pass indicating more fish of this species/lifestage may have remained in site.
              Mark-recaptured required to reduce uncertainties.',
scroll = F)| local_name | species_code | life_stage | catch | density_100m2 | nfc_pass |
|---|---|---|---|---|---|
| 125261_ds_ef1 | CC | – | 1 | 1.1 | FALSE |
| 125261_ds_ef1 | RB | fry | 8 | 8.9 | FALSE |
| 125261_ds_ef1 | RB | parr | 6 | 6.6 | FALSE |
| 125261_ds_ef1 | RB | juvenile | 1 | 1.1 | FALSE |
| 125261_ds_ef2 | RB | fry | 5 | 4.1 | FALSE |
| 125261_ds_ef2 | RB | parr | 5 | 4.1 | FALSE |
| 125261_ds_ef3 | BB | – | 3 | 7.7 | FALSE |
| 125261_ds_ef3 | CC | – | 3 | 7.7 | FALSE |
| 125261_ds_ef3 | RB | fry | 2 | 5.1 | FALSE |
| 125261_ds_ef3 | RB | parr | 2 | 5.1 | FALSE |
| 125261_ds_ef3 | SU | – | 1 | 2.6 | FALSE |
| 125261_us_ef1 | CC | – | 4 | 8.1 | FALSE |
| 125261_us_ef1 | RB | fry | 7 | 14.2 | FALSE |
| 125261_us_ef1 | RB | parr | 2 | 4.0 | FALSE |
| 125261_us_ef2 | CC | – | 1 | 2.3 | FALSE |
| 125261_us_ef2 | RB | fry | 2 | 4.6 | FALSE |
| 125261_us_ef2 | RB | parr | 3 | 6.9 | FALSE |
| 125261_us_ef2 | RB | juvenile | 1 | 2.3 | FALSE |
| 125261_us_ef2 | RB | adult | 1 | 2.3 | FALSE |
| 125261_us_ef3 | CC | – | 8 | 11.6 | FALSE |
| 125261_us_ef3 | RB | fry | 16 | 23.3 | FALSE |
| 125261_us_ef3 | RB | parr | 1 | 1.5 | FALSE |
| 125261_us_ef3 | RB | juvenile | 2 | 2.9 | FALSE |
|
* nfc_pass FALSE means fish were captured in final pass indicating more fish of this species/lifestage may have remained in site. Mark-recaptured required to reduce uncertainties. |
my_caption <- paste0('Densites of fish (fish/100m2) captured upstream and downstream of PSCIS crossing ', my_site, ' in 2023.')


fish_abund |>
  dplyr::filter(site == my_site & species_code != "NFC")  |>
  ggplot(aes(x = location, y = density_100m2)) +
  geom_boxplot() +
  facet_grid(species_code ~ life_stage, scales = "fixed",
             as.table = T) +
  theme(legend.position = "none",
        axis.title.x = element_blank()) +
  geom_dotplot(binaxis = "y",
               stackdir = "center", dotsize = 1) +
  ylab(expression(Density ~
                    (fish/100 ~ m^2)))+
  cowplot::theme_minimal_hgrid() +
  cowplot::panel_border()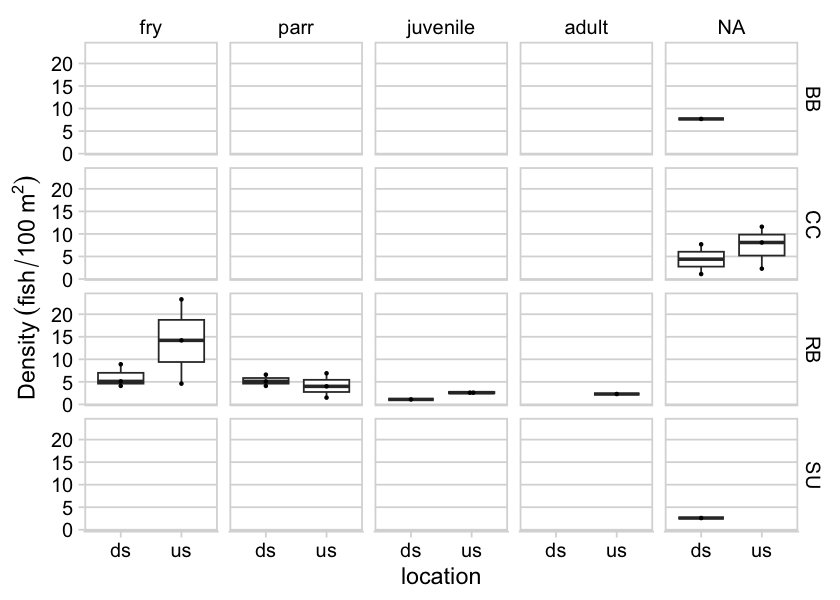
Figure 5.14: Densites of fish (fish/100m2) captured upstream and downstream of PSCIS crossing 125261 in 2023.
tab_fish_sites_sum_2024 %>%
  tidyr::separate(site, into = c("site_id", "location",
        "ef"), remove = F) |>
  dplyr::filter(site_id == my_site) |>
  dplyr::select(site, passes, ef_length_m, ef_width_m,
            area_m2, enclosure) |>
  fpr::fpr_kable(caption_text = paste0("Fish sampling site summary for ",
my_site, " in 2024."), scroll = F)| site | passes | ef_length_m | ef_width_m | area_m2 | enclosure |
|---|---|---|---|---|---|
| 125261_ds_ef1 | 1 | 21 | 3.8 | 79.8 | partial enclosure |
| 125261_ds_ef2 | 1 | 21 | 3.2 | 67.2 | partial enclosure |
| 125261_us_ef1 | 1 | 29 | 3.4 | 98.6 | partial enclosure |
| 125261_us_ef2 | 1 | 22 | 4.2 | 92.4 | partial enclosure |
fish_abund_2024|>
  dplyr::filter(site == my_site) |>
  dplyr::select(local_name, species_code, life_stage, catch, density_100m2, nfc_pass) |>
  fpr::fpr_kable(caption_text = paste0("Fish sampling density results summary for ",
            my_site, " in 2024."),
            footnote_text = "nfc_pass FALSE means fish were captured in final pass indicating more fish of this species/lifestage may have remained in site.\n              Mark-recaptured required to reduce uncertainties.",
scroll = F)| local_name | species_code | life_stage | catch | density_100m2 | nfc_pass |
|---|---|---|---|---|---|
| 125261_ds_ef1 | Rainbow Trout | fry | 7 | 8.8 | FALSE |
| 125261_ds_ef1 | Rainbow Trout | juvenile | 1 | 1.3 | FALSE |
| 125261_ds_ef1 | Rainbow Trout | parr | 5 | 6.3 | FALSE |
| 125261_ds_ef1 | Sculpin (General) | – | 9 | 11.3 | FALSE |
| 125261_ds_ef2 | Rainbow Trout | adult | 3 | 4.5 | FALSE |
| 125261_ds_ef2 | Rainbow Trout | fry | 1 | 1.5 | FALSE |
| 125261_ds_ef2 | Rainbow Trout | juvenile | 2 | 3.0 | FALSE |
| 125261_ds_ef2 | Rainbow Trout | parr | 4 | 6.0 | FALSE |
| 125261_ds_ef2 | Sculpin (General) | – | 4 | 6.0 | FALSE |
| 125261_us_ef1 | Rainbow Trout | adult | 1 | 1.0 | FALSE |
| 125261_us_ef1 | Rainbow Trout | fry | 6 | 6.1 | FALSE |
| 125261_us_ef1 | Rainbow Trout | juvenile | 3 | 3.0 | FALSE |
| 125261_us_ef1 | Rainbow Trout | parr | 6 | 6.1 | FALSE |
| 125261_us_ef1 | Sculpin (General) | – | 1 | 1.0 | FALSE |
| 125261_us_ef2 | Rainbow Trout | adult | 2 | 2.2 | FALSE |
| 125261_us_ef2 | Rainbow Trout | fry | 5 | 5.4 | FALSE |
| 125261_us_ef2 | Rainbow Trout | juvenile | 4 | 4.3 | FALSE |
| 125261_us_ef2 | Rainbow Trout | parr | 10 | 10.8 | FALSE |
| 125261_us_ef2 | Sculpin (General) | – | 3 | 3.2 | FALSE |
|
* nfc_pass FALSE means fish were captured in final pass indicating more fish of this species/lifestage may have remained in site. Mark-recaptured required to reduce uncertainties. |
my_caption <- paste0('Densites of fish (fish/100m2) captured upstream and downstream of PSCIS crossing ', my_site, ' in 2024.')

fpr::fpr_plot_fish_box(dat = fish_abund_2024) 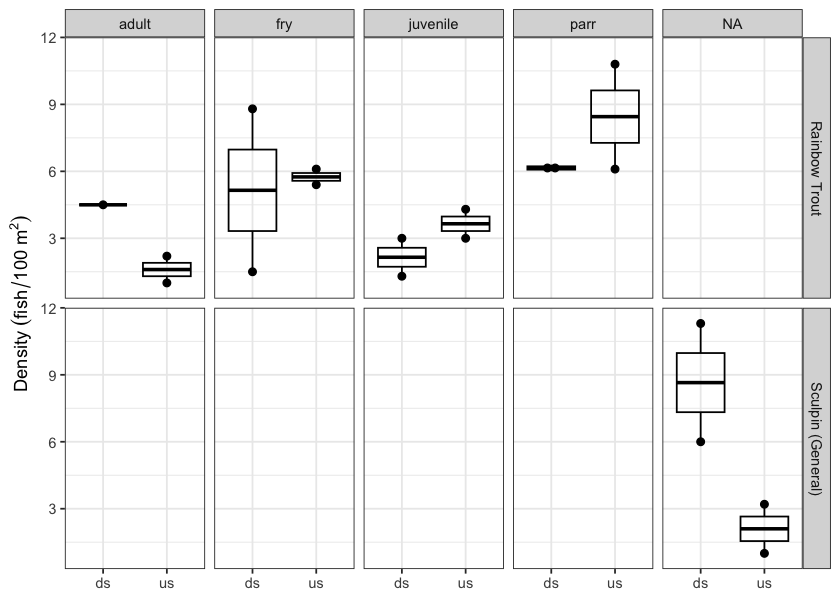
Figure 5.15: Densites of fish (fish/100m2) captured upstream and downstream of PSCIS crossing 125261 in 2024.
my_photo1 = fpr::fpr_photo_pull_by_str(str_to_pull = 'ds_ef2_typical1')

my_caption1 = paste0('Habitat electrofished downstream of PSCIS crossing ', my_site, ' in 2024.')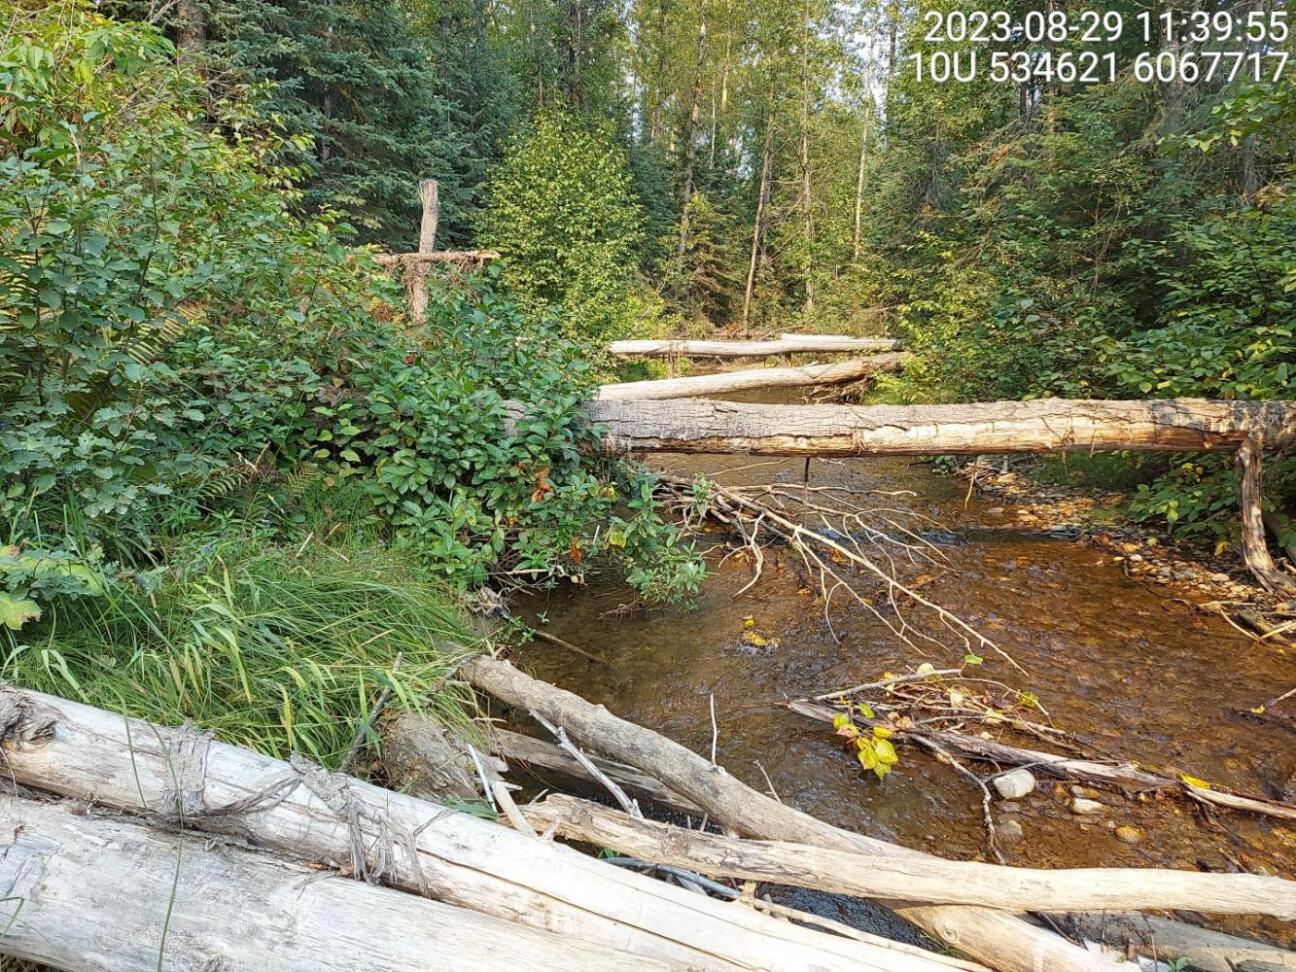
Figure 5.16: Habitat electrofished downstream of PSCIS crossing 125261 in 2024.
my_photo2 = fpr::fpr_photo_pull_by_str(str_to_pull = '_us_ef3_bottom')

my_caption2 = paste0('Habitat electrofished upstream of PSCIS crossing ', my_site, ' in 2024.')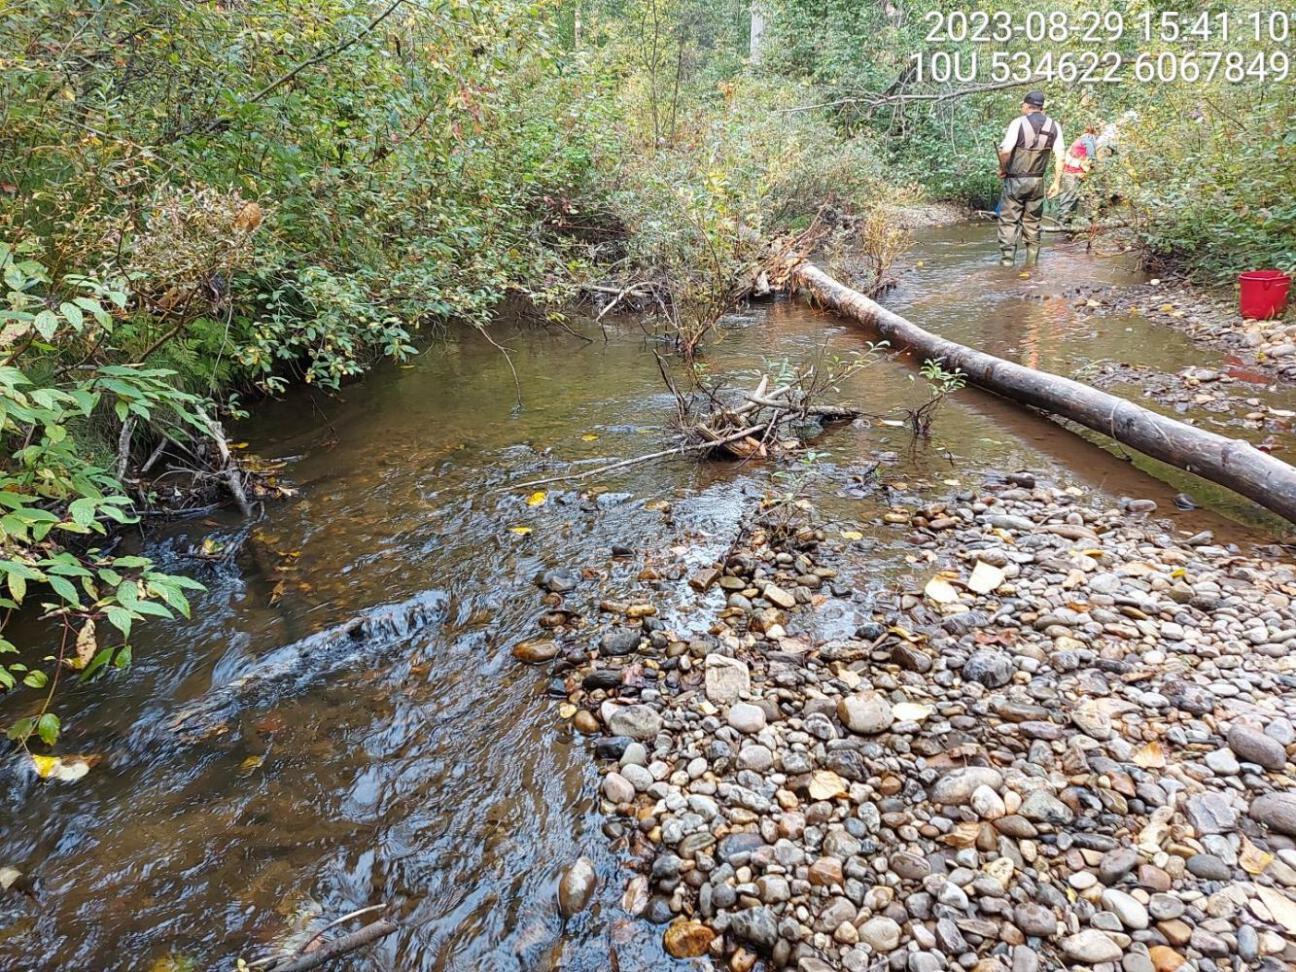
Figure 5.17: Habitat electrofished upstream of PSCIS crossing 125261 in 2024.
my_caption <- paste0('Left: ', my_caption1, ' Right: ', my_caption2)

knitr::include_graphics(my_photo1)
knitr::include_graphics("fig/pixel.png")
knitr::include_graphics(my_photo2)
my_photo1 = fpr::fpr_photo_pull_by_str(str_to_pull = '_rb1_')
my_caption1 = paste0('Rainbow trout captured downstream of PSCIS crossing ', my_site, ' in 2023.')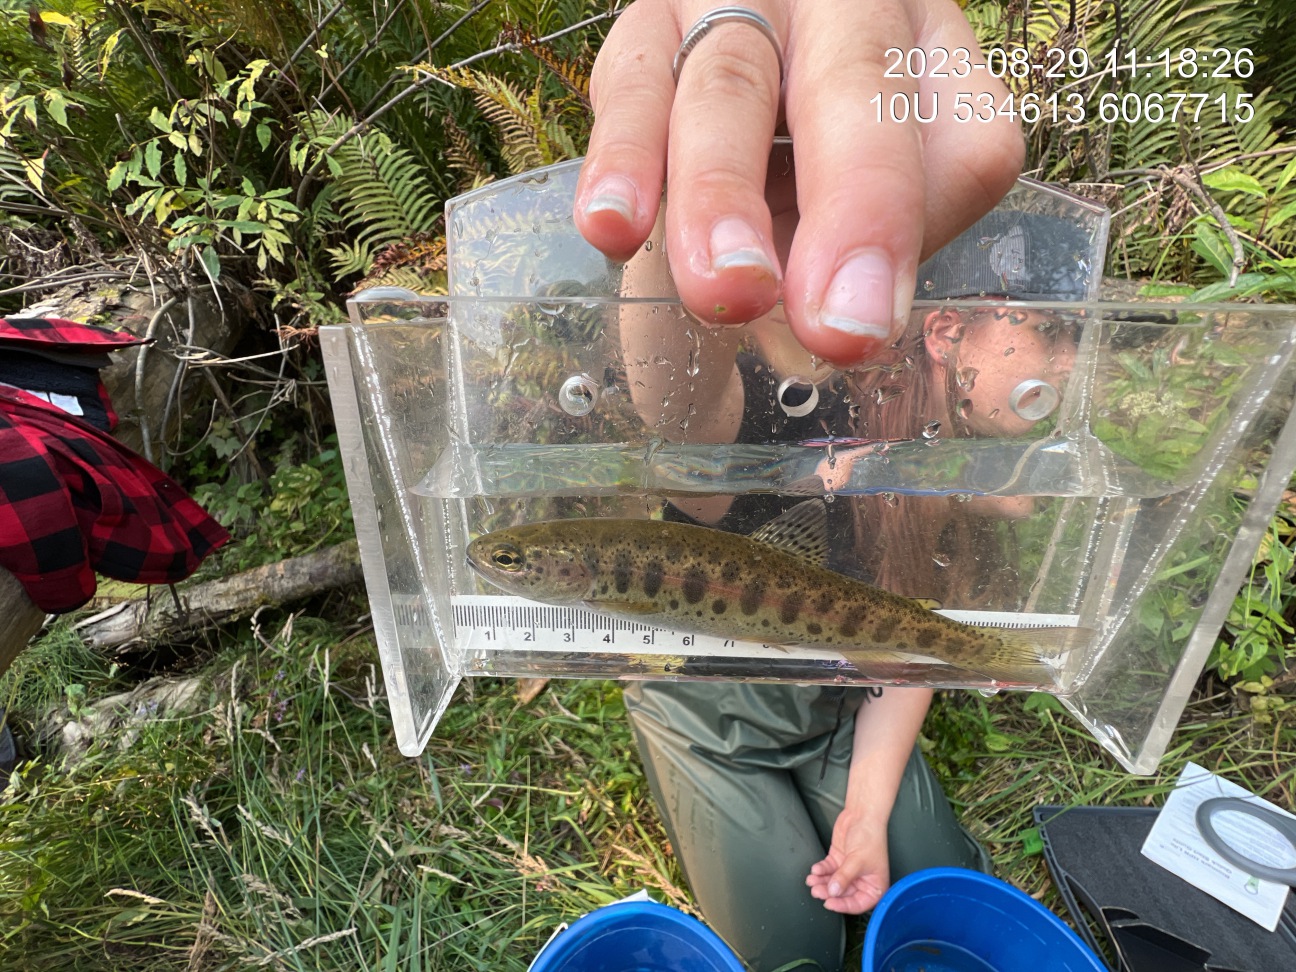
Figure 5.18: Rainbow trout captured downstream of PSCIS crossing 125261 in 2023.
my_photo2 = fpr::fpr_photo_pull_by_str(str_to_pull = '_bb1_')

my_caption2 = paste0('Burbot captured downstream of PSCIS crossing ', my_site, ' in 2023.')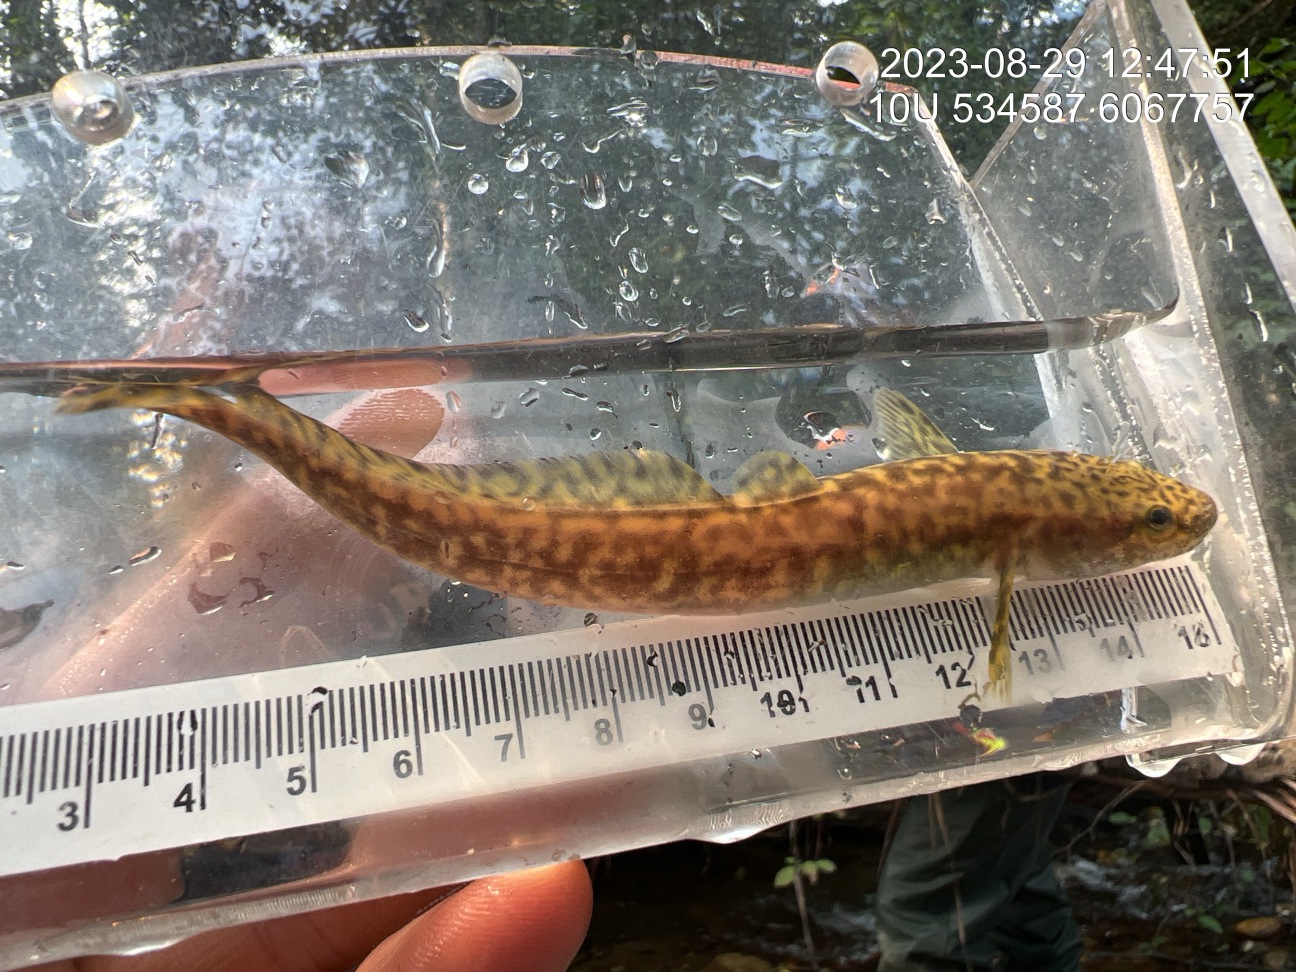
Figure 5.19: Burbot captured downstream of PSCIS crossing 125261 in 2023.
my_caption <- paste0('Left: ', my_caption1, ' Right: ', my_caption2)

knitr::include_graphics(my_photo1)
knitr::include_graphics("fig/pixel.png")
knitr::include_graphics(my_photo2)
my_photo1 = fpr::fpr_photo_pull_by_str(str_to_pull = '_lw_')
my_caption1 = paste0('Collecting length and weight of all fish captured at Fern Creek in 2023.')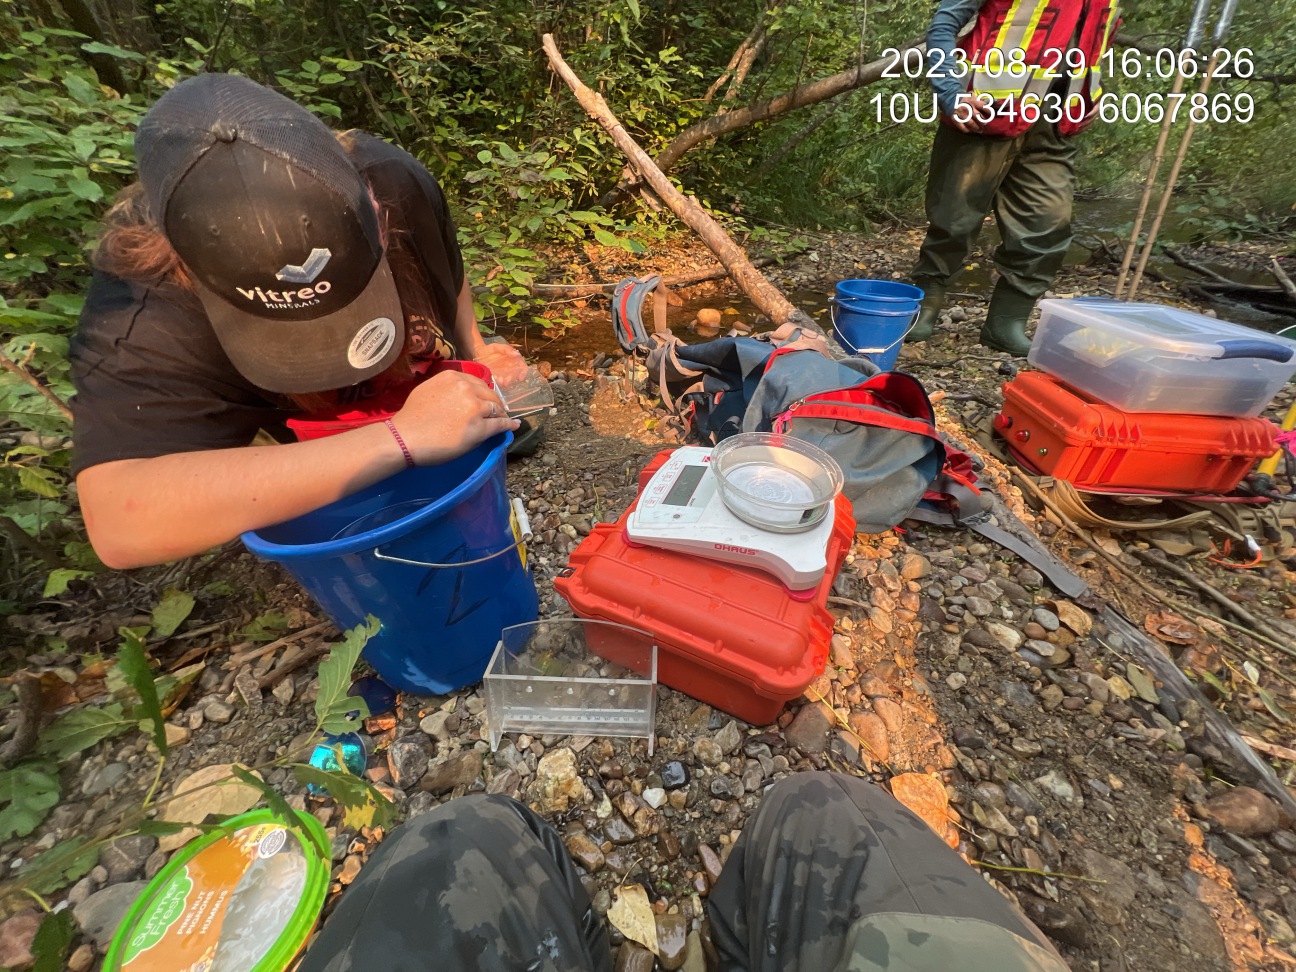
Figure 5.20: Collecting length and weight of all fish captured at Fern Creek in 2023.
my_photo2 = fpr::fpr_photo_pull_by_str(str_to_pull = '_pt1_')

my_caption2 = paste0('PIT tagging rainbow trout and burbot with a fork length >60mm at Fern Creek in 2023.')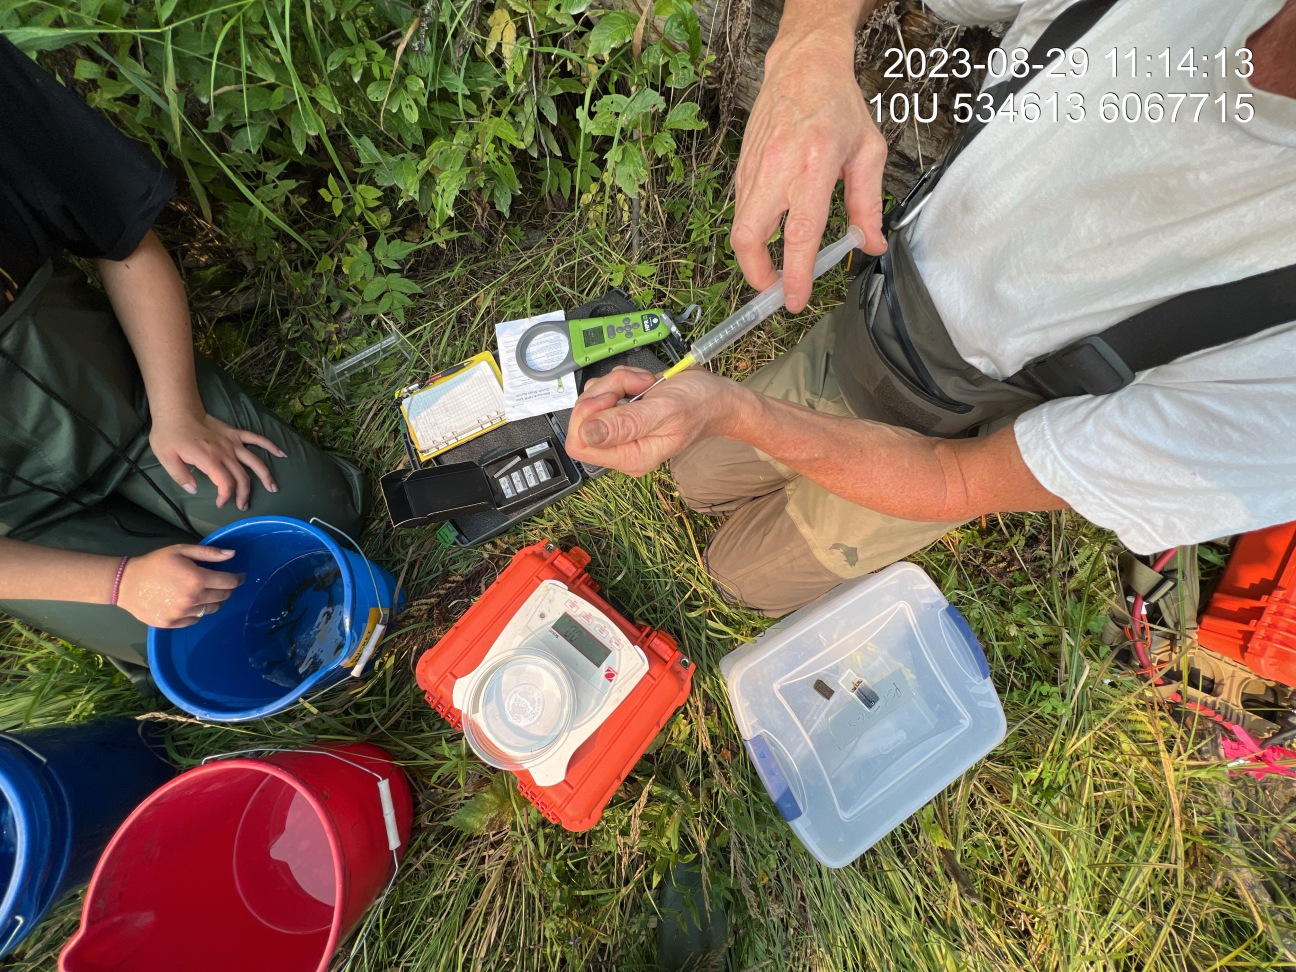
Figure 5.21: PIT tagging rainbow trout and burbot with a fork length >60mm at Fern Creek in 2023.
my_caption <- paste0('Left: ', my_caption1, ' Right: ', my_caption2)

knitr::include_graphics(my_photo1)
knitr::include_graphics("fig/pixel.png")
knitr::include_graphics(my_photo2)
my_photo1 = fpr::fpr_photo_pull_by_str(str_to_pull = 'fish1_2024')
my_caption1 = paste0('Rainbow trout captured downstream of PSCIS crossing ', my_site, ' in 2024.')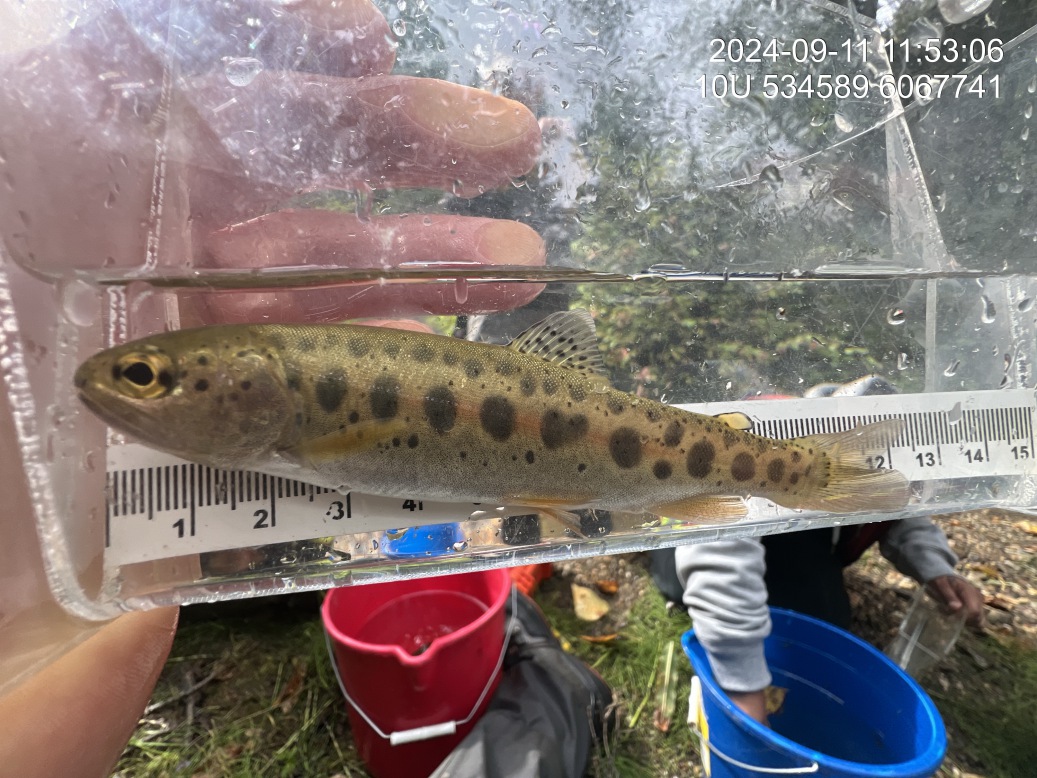
Figure 5.22: Rainbow trout captured downstream of PSCIS crossing 125261 in 2024.
my_photo2 = fpr::fpr_photo_pull_by_str(str_to_pull = 'fish2_2024')

my_caption2 = paste0('Rainbow trout captured upstream of PSCIS crossing ', my_site, ' in 2024.')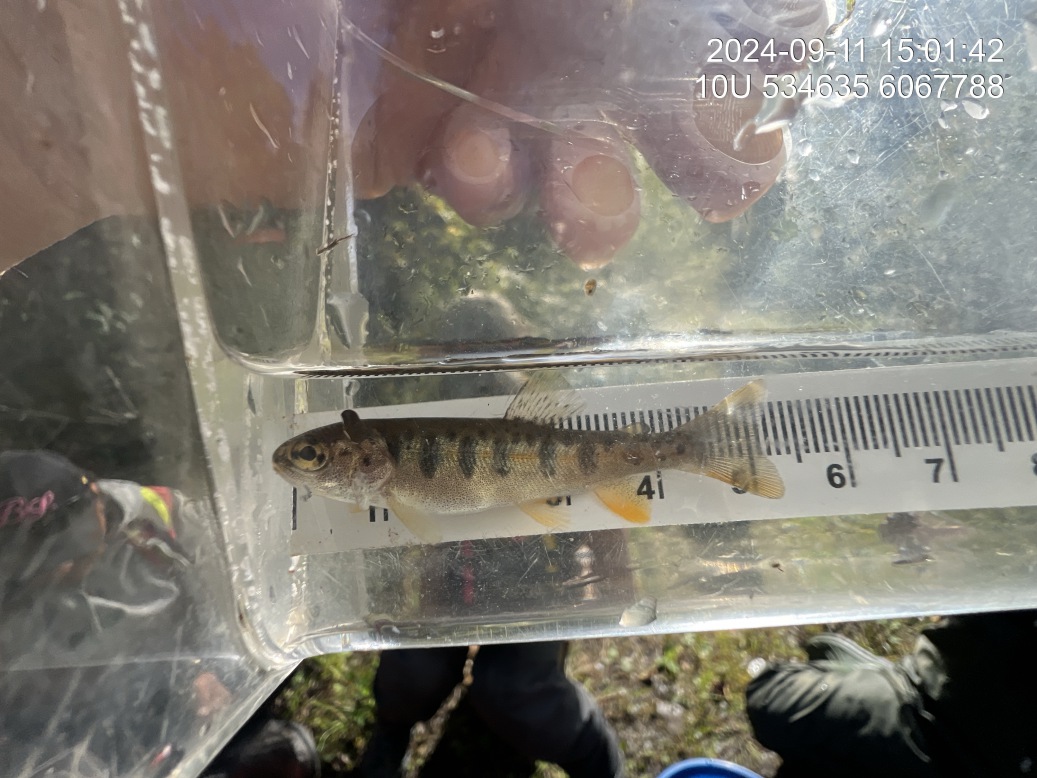
Figure 5.23: Rainbow trout captured upstream of PSCIS crossing 125261 in 2024.
my_caption <- paste0('Left: ', my_caption1, ' Right: ', my_caption2)

knitr::include_graphics(my_photo1)
knitr::include_graphics("fig/pixel.png")
knitr::include_graphics(my_photo2)