
The published discharge table
(vignette("segment-discharge")) gives an FWA segment
thirteen values per source it covers (routed PCIC covers fewer segments
than the balance): the mean annual flow (month 0) and the mean flow of
each calendar month (months 1–12). This article is about the twelve
months. It shows how to read them for one stream, sets them against
observed flow and Chinook life-stage windows on the Bulkley River, and
scores both sources month by month at the gauges the water balance is
calibrated on. The scores are where the monthly values are right and
where they are not, and the article ends with the list of what to
fix.
What a month holds
Each source fills the twelve months its own way:
-
Routed PCIC (
pcic_routed) is the mean of each month’s daily flow over 1951–2012 from PCIC’s Raven routing of VIC-GL runoff, placed on FWA segments by NewGraphEnvironment/fwapg#6. Its month 0 is the plain mean of the twelve months, not weighted by their days. On the three segments below that moves it by at most 0.4%. -
The water balance (
wet_balance) is the annual flow over 1981–2010 split into months by a model of each month’s share of the year, fitted to the gauges (wet_share_fit()). Its months are volume shares of its month 0, so they add up to it exactly.
The two sources cover different periods. Neither is the gauge record. Each comparison below says which period it uses.
Reading a segment’s twelve months
The parts are public and the bucket allows no listing, so the
manifest names them. One stream is one linear_feature_id.
Naming its watershed group as well lets duckdb skip the row groups that
cannot hold it, which keeps the read to seconds.
library(wet)
# Buck Creek at its mouth, where gauge 08EE013 sits
q <- wet_segment_monthly(NULL, 17094080, groups = "BULK")

# twelve months a column per source
reshape(q[q$month > 0, c("source", "month", "q_m3s")], idvar = "month",
        timevar = "source", direction = "wide")
wet_segment_monthly() reads the parts through duckdb
when it is given no database connection, and the table
wet_db_load() writes when it is. It returns
linear_feature_id, month, q_m3s, source, in the shape of
wet_station_monthly()’s
station_number, month, q_m3s for a gauge, so a gauge
comparison is a join on month. A segment with no value for
a source comes back with its months as NA, not as missing
rows. data-raw/monthly_vignette_data.R runs this read and
refuses to bundle the values below unless it returns them.
The Bulkley at three gauges
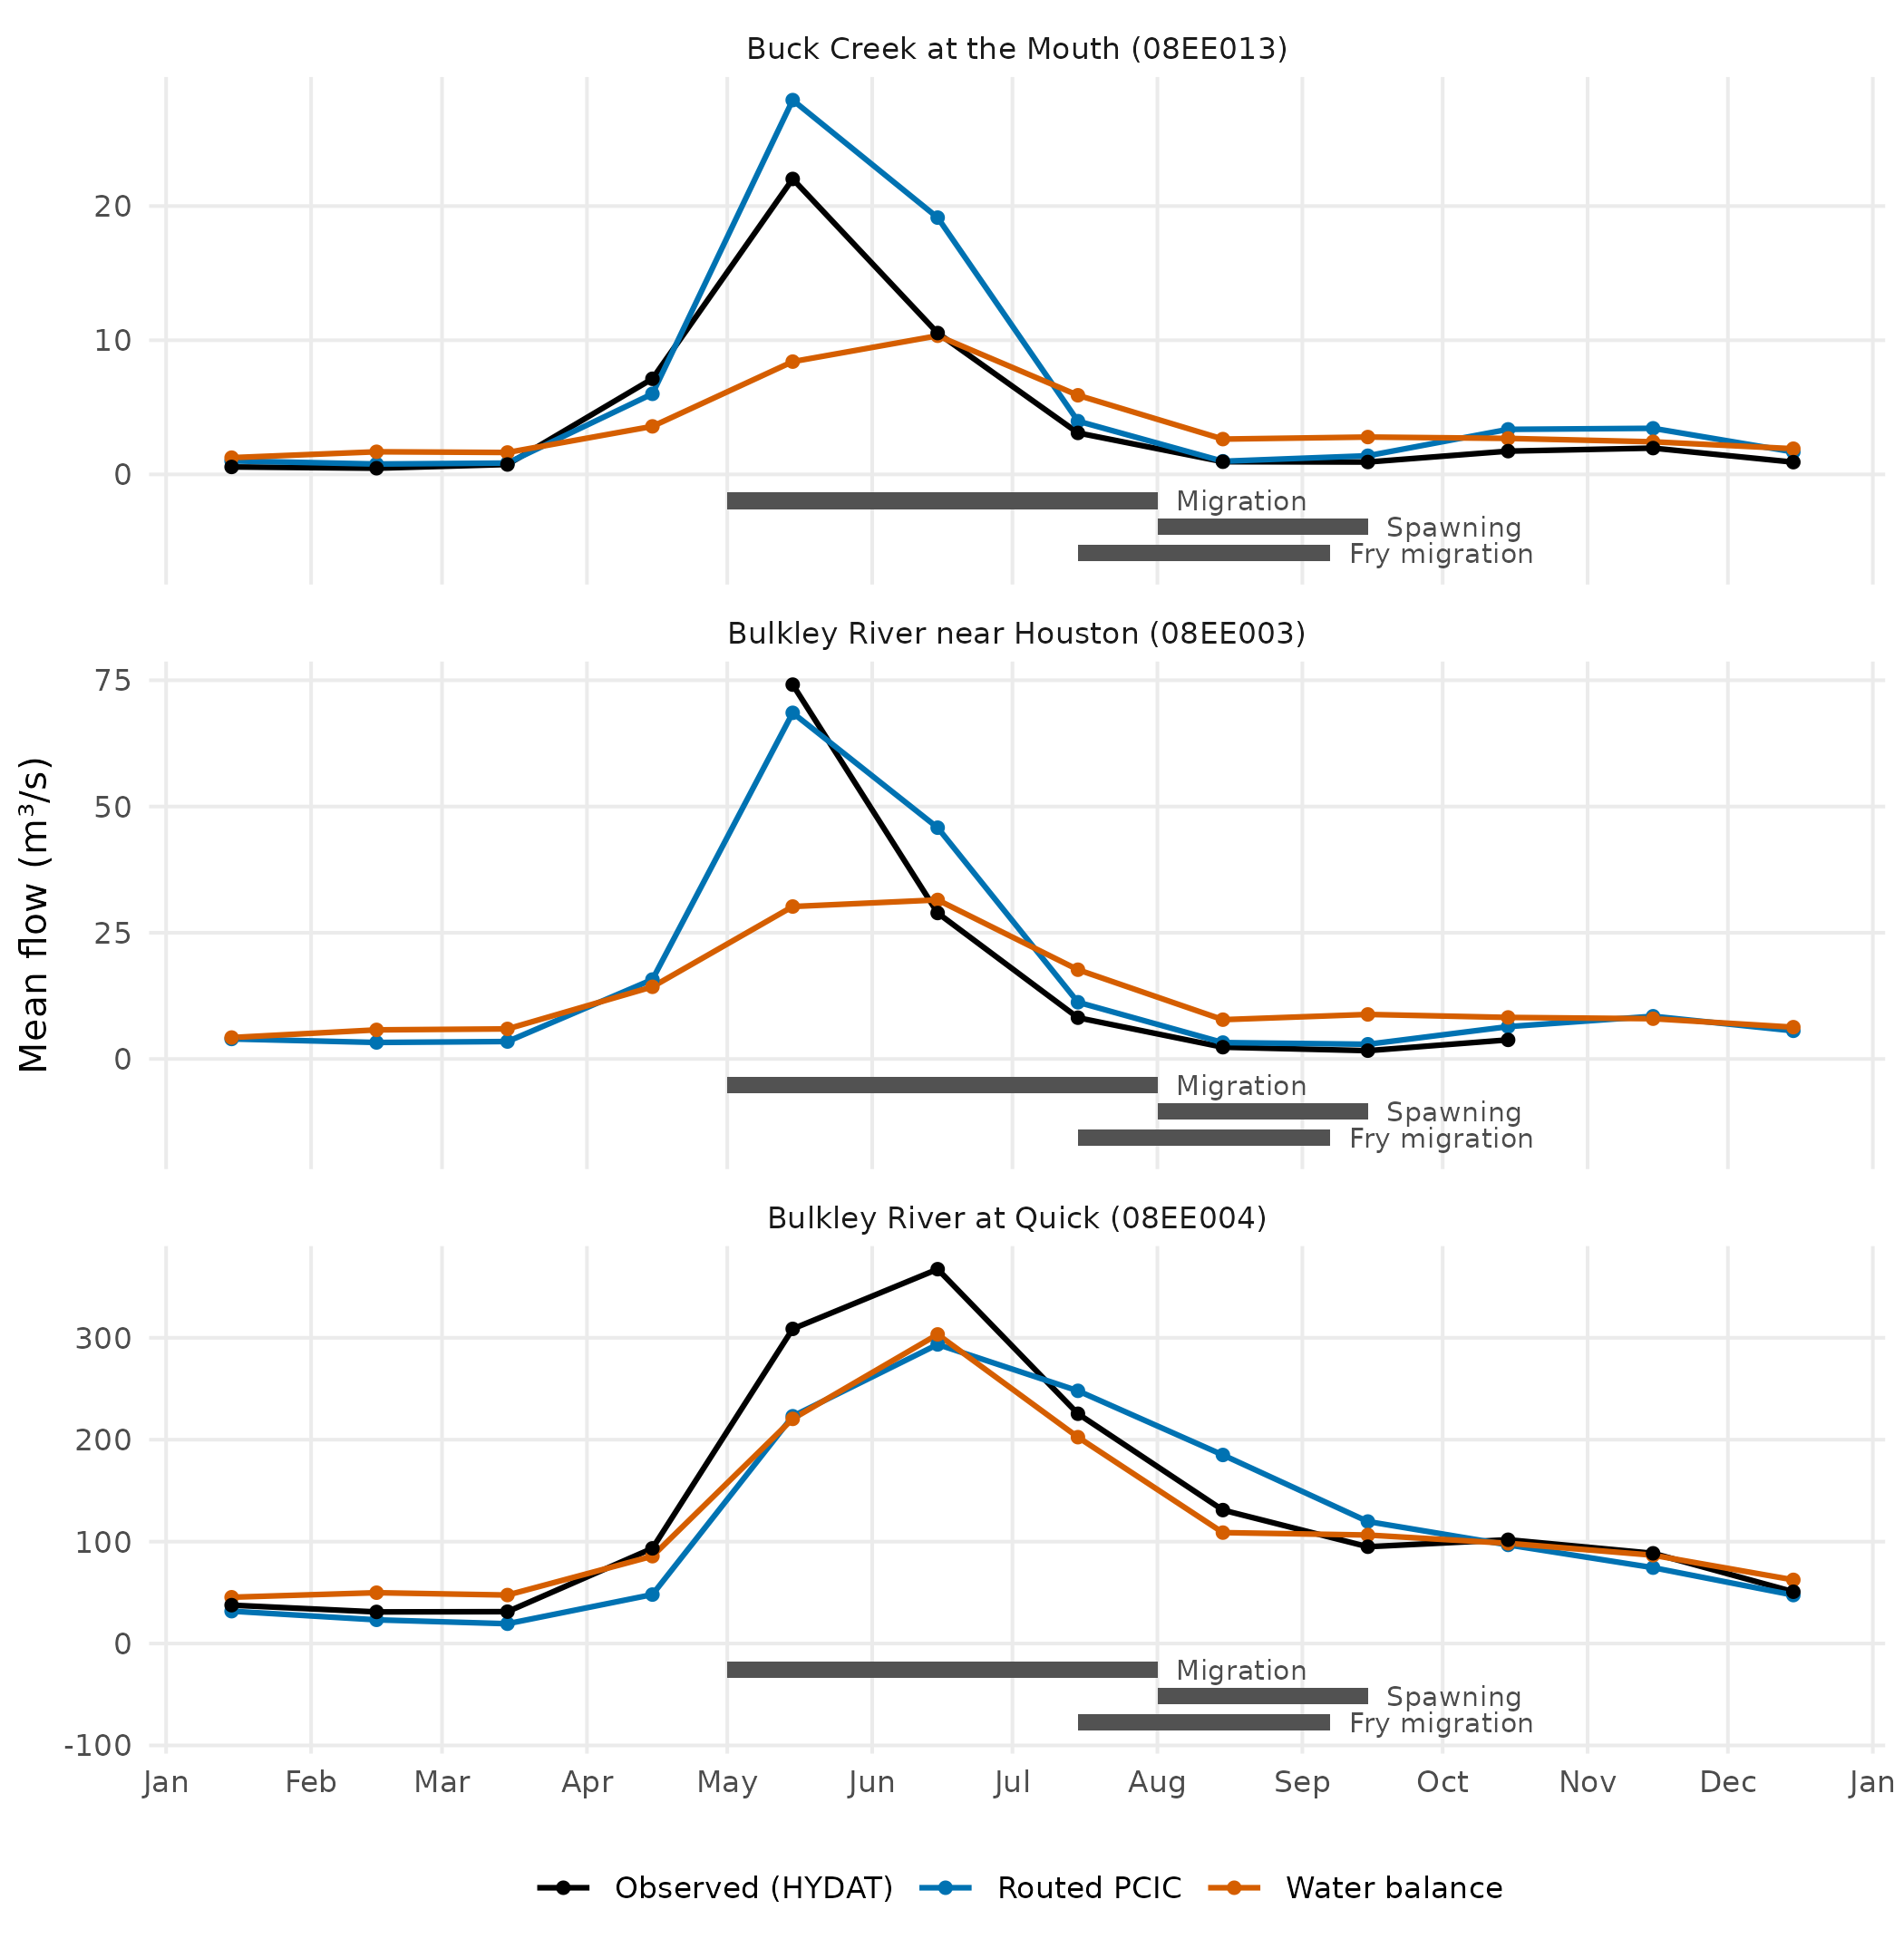
Mean monthly flow on the segments three Bulkley gauges sit on, from each source, beside the gauge’s observed monthly means over 1981–2010. Routed PCIC is over 1951–2012. At Bulkley River near Houston (08EE003), a seasonal gauge, only the months with 10 or more years of 20 days’ flow are drawn (May–October). The strips under each panel are the Chinook windows.
At Buck Creek (08EE013), a snowmelt stream of 567 km², the gauge peaks in May and so does routed PCIC, which overshoots it. The water balance’s freshet is low and a month late: its May–June flow is 9.4 m³/s against 16.4 observed and 23.6 routed, and its highest month, June, is 10.3 m³/s against the gauge’s May 22, under half of it. It carries more water than the gauge from July through March. On the Bulkley at Quick (08EE004), a basin of 7,341 km², both sources fall short of the gauge in May–June by about a quarter (338 m³/s observed, 258 routed, 261 balance). The balance is still high from January to March, and routed PCIC is high in July and August.
Both gauges are among those the balance is calibrated on, so on their segments its published values are in-sample. The scores further down use the balance held out instead. 08EE003 is not a calibration gauge: it is seasonal and has no complete years in 1981–2010, so on its segment the balance is a genuine estimate for an ungauged site, and the gauge can check it only in open water.
Flow in the Chinook windows
The windows start and end mid-month, and the product holds monthly means. A window’s flow from the product is therefore a day-weighted mean: each day of the window takes its month’s mean. Two columns of the table below separate that approximation from model error. Daily record is the gauge’s own daily flow, averaged over the window in each year, and Monthly, day-weighted is the same years’ observed monthly means put through the day weighting. In migration and spawning they agree within 3%. In fry migration they differ by up to 27%, because that window takes half of July, when the flow is falling fast, at July’s mean. Even there the approximation is smaller than either source’s error, which in that window reaches +74% for routed PCIC and +237% for the balance.
| Gauge | Window | Years | Daily record | Monthly, day-weighted | Routed PCIC | Water balance |
|---|---|---|---|---|---|---|
| Buck Creek at the Mouth (08EE013) | Migration (May 1 – Aug 1) | 30 | 11.7 | 11.7 | 16.8 (+44%) | 8.1 (-30%) |
| Spawning (Aug 1 – Sep 15) | 29 | 0.9 | 0.9 | 1.1 (+22%) | 2.7 (+194%) | |
| Fry migration (Jul 15 – Sep 7) | 29 | 1.3 | 1.6 | 2.0 (+54%) | 3.7 (+189%) | |
| Bulkley River near Houston (08EE003) | Migration (May 1 – Aug 1) | 18 | 36.8 | 36.8 | 41.4 (+12%) | 26.2 (-29%) |
| Spawning (Aug 1 – Sep 15) | 18 | 2.1 | 2.1 | 3.1 (+50%) | 8.1 (+287%) | |
| Fry migration (Jul 15 – Sep 7) | 18 | 3.3 | 4.0 | 5.7 (+74%) | 11.0 (+237%) |
Monthly error at the gauges
Monthly flow is scored at the 315 gauges the water balance is
calibrated on, against each gauge’s monthly means over its complete
years in 1981–2010. The balance is scored held out:
each gauge’s months come from a fit that never saw it or its neighbours
(blocked cross-validation, as
research/water_balance_method.md describes), as the fit
stored them. Routed PCIC is scored on the segment each gauge snapped to,
at the 290 gauges whose segment carries routed flow, less 11 whose
segment carries under 20% of the observed annual flow (left out as the
annual routed comparison leaves them out, which attributes each one: to
the outlet’s placement or the gauge’s snap, to PCIC’s runoff, or
unresolved). That leaves 279 gauges. Each source is scored on every
month of all its own gauges, as modelled over observed flow: the balance
on 3,780 gauge-months, routed PCIC on 3,348. In 70 of the balance’s
gauge-months the held-out share is zero, so it predicts no flow at all
(14 of them in January). They count as errors of −100%.
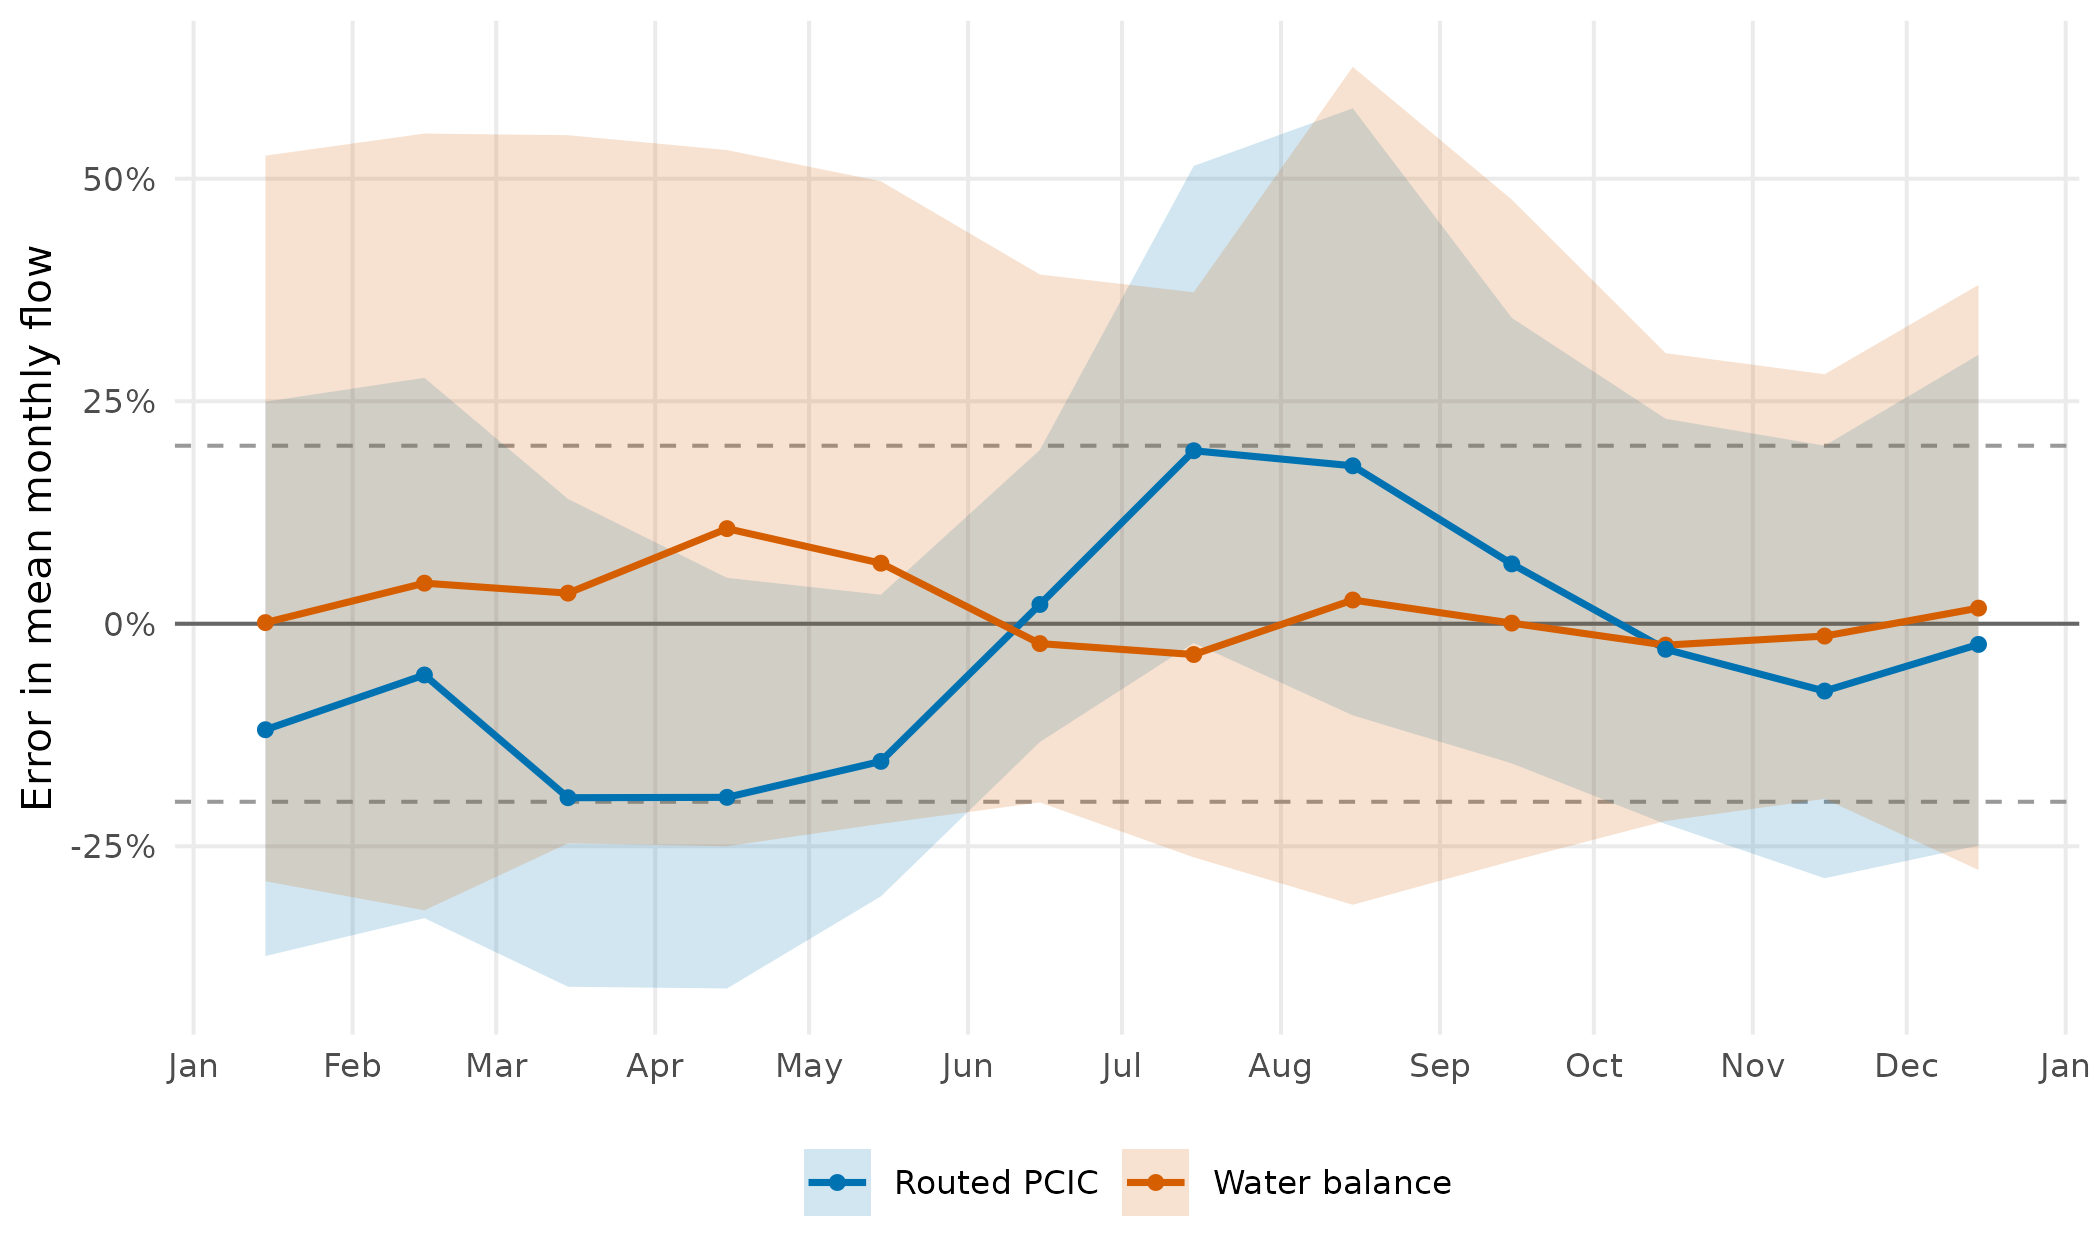
Error in mean monthly flow by month: the median (line) and the middle half of gauges (band), as a percentage of the gauge’s 1981–2010 mean. The water balance is held out (blocked cross-validation) at 315 calibration gauges; routed PCIC, over 1951–2012, at the 279 of them it covers. Dashed lines mark ±20%.
| Month | Balance median | Balance within ±20% | Routed median | Routed within ±20% |
|---|---|---|---|---|
| Jan | 0% | 27% | -12% | 30% |
| Feb | +5% | 30% | -6% | 34% |
| Mar | +3% | 31% | -20% | 28% |
| Apr | +11% | 28% | -20% | 35% |
| May | +7% | 30% | -15% | 39% |
| Jun | -2% | 40% | +2% | 61% |
| Jul | -3% | 34% | +19% | 39% |
| Aug | +3% | 25% | +18% | 34% |
| Sep | 0% | 33% | +7% | 46% |
| Oct | -2% | 42% | -3% | 46% |
| Nov | -1% | 44% | -8% | 41% |
| Dec | +2% | 33% | -2% | 36% |
The two sources’ errors have different shapes.
-
The water balance reads high in April and May, by a
median of +7% to +11%, and within ±5% in the other months. At the 25
gauges routed PCIC does not reach, 19 of them in WSC drainage area 10
(the Liard), it reads low in winter instead, by a median of -16% in
January and -62% to -75% in February–March. Its spread is wide in every
month: fewer than half of the gauges fall within ±20% in any month. Its
months are an annual flow times a share of the year modelled from
monthly precipitation, temperature and evapotranspiration, elevation,
location, and two snow terms from ERA5-Land: the day by which half the
snowpack has melted and the peak snow water equivalent
(
wet_share_fit(), #16). The snow terms reduced the bias in winter and early spring (research/water_balance_method.md), but the freshet is still flattened: at the 243 gauges whose observed flow peaks in May or June, the balance is below the gauge in that month at 65% of them, by a median of -13%. Held out, its median Nash–Sutcliffe efficiency on the monthly climatology is 0.73 over its 315 gauges. This error is ours. - Routed PCIC, on the 279 gauges both sources are scored at, has more of them within ±20% than the balance has in 10 of the twelve months, May to September among them. It reads low in March and April (median -20%) and high in July and August (+19%): as if its melt starts late and runs on. Its median monthly efficiency is 0.81 over its 279 gauges.
Routed PCIC’s period is 1951–2012 and the gauges’ is 1981–2010, so part of its error could be the period. At the 113 calibration gauges with 40 or more complete years in 1951–2012 and routed flow on their segment (less 2 whose segment carries under 20%), observed flow over the longer period differs from 1981–2010 by a median of -7% in March–April and +6% in July–August. Scored against the gauges’ own 1951–2012 means, routed PCIC is still -19% in March–April and +10% in July–August. Against 1981–2010 at the same gauges it is -23% and +14%. The period explains about 18% of the spring shortfall and 32% of the summer excess. What is left is the shape of the median gauge. Gauge by gauge, over its own period, routed PCIC is low in March–April at 66% of the 113 gauges and high in July–August at 63% (both at 40%). A misplaced outlet changes one gauge’s hydrograph, mostly in size; it would not move the median of 113 gauges toward a late melt. So the median shape comes from the routed model, not from the placement. That attributes it to PCIC’s model, which wet does not run; it is recorded here and in #6. Routed flow over 1981–2010 (NewGraphEnvironment/fwapg#25) would remove the period question.
A second place was not needed to find these patterns, because the province-wide scores already span regimes. The table below splits them by basin size and by lake outlets, which a regime contrast would have sampled one at a time. Routed PCIC is the stronger source on every basin size but the smallest (under 100 km²), where it falls below the balance. The balance is weakest at lake outlets, whose flow a lake holds back and releases later in the year; its shares know nothing of the lake, and routing does.
| Group | Gauges | Balance | Routed |
|---|---|---|---|
| All gauges | 279 | 0.76 | 0.81 |
| <100 km² | 74 | 0.55 | 0.40 |
| 100-1000 | 105 | 0.76 | 0.79 |
| 1000-10000 | 82 | 0.81 | 0.91 |
| >10000 | 18 | 0.88 | 0.94 |
| Lake outlet | 17 | 0.53 | 0.93 |
| Not a lake outlet | 262 | 0.76 | 0.81 |
What’s next
What this exploration found that would make the monthly values more useful, each with its issue:
- Routed flow over 1981–2010 (NewGraphEnvironment/fwapg#25), so both sources and the gauges share one period.
- Routed PCIC’s seasonal shape (#67): low in early spring, high in late summer, beyond what the period explains. Attributed to PCIC’s model. The issue records the evidence and a draft report to PCIC.
- Monthly scoring by region and season (#6), which takes over the scoring this article starts.
Limits
- On a calibration gauge’s own segment the published balance is in-sample. The scores above use the held-out balance instead.
- 08EE003 is seasonal: its monthly means cover May–October, from 19 of the years 1981–2010. Its windows rest on the years the window table gives.
- A window’s flow from monthly means is an approximation (the window
table measures it).
wet_flow_window()labels itbasis = "monthly", and gives"daily"from the same call once daily flow is published (#70). - Routed PCIC’s month 0 is a plain mean of its months, so its months converted to millimetres do not add up to its annual runoff exactly.
Validation
data-raw/monthly_vignette_data.R built the data at wet
fc105e4 on 2026-10-14, from the published build at wet acb820f (https://fresh-bc.s3.us-west-2.amazonaws.com/discharge/fwa/v1/manifest.json)
and the water balance fit on HYDAT 2026-07-17 (AET cfu). It checked the
bundled published values against what they were built from, and refused
to write unless none differed:
| Check | Compared | Differing |
|---|---|---|
| routed months 1-12 (Bulkley segments and gauges) = fwapg monthly table | 3,480 | 0 |
| routed month 0 (Bulkley segments and gauges) = mean of fwapg’s 12 months | 290 | 0 |
| balance month 0 (Bulkley watersheds), recomputed = fit output | 2 | 0 |
| balance months the fit’s output holds (Bulkley segments) = fit output via lut | 3 | 0 |
| balance months 0-12 (Bulkley segments whose watershed the bundle holds) = fit recomputed via lut | 26 | 0 |
Where the data were built, the fit’s output held month 0 only, so the
balance’s months 1–12 were recomputed from the fit for the watersheds
that copy held. The balance’s months that neither check covers rest on
the publish report’s value-by-value check of every month
(data/checks/discharge_publish_20260717.txt), which the
script requires to have passed for the live build. The held-out monthly
balance is the one the fit stored, under the share specification it
shipped, and scored again it gives the fit’s stored per-gauge scores.
Routed flow is fwapg 341b078’s table (40524444 rows, 3377037 segments, 0
null flows, total 178035348.248310 m3/s).