3 Planning for the Field
We use QGIS and Mergin Maps for our fish passage preparation, data management and analysis. QGIS (Quantum Geographic Information System) is a free, open-source software that allows users to create, edit, visualize, analyze, and publish geospatial information (QGIS Development Team 2009). Mergin Maps is a geodata platform that allows us to collaborate with others by collecting data in the field and syncing to a shared QGIS project (MerginMaps 2023). Check out the Mergin Maps documentation for more information.
Before heading out into the field, we research the area we will be going to by visualizing the area on QGIS. We want to understand all we can about a site before arriving there. Our QGIS projects include an extensive amount of information that can be relevant for a site, such as information regarding:
- Land ownership
- Past fish observations
- The conditions of the crossing structure
- Links to relevant reports
- How to access sites
- Habitat models
- Road tenure information
This section will get you started with all our field preparation procedures.
3.1 Mergin Maps on your computer
Map creation, research, planning, and data QA takes place using QGIS and Mergin Maps on our computers.
3.1.1 Set up
Set up QGIS on your computer:
Follow this link to the QGIS Download Page to install the latest version.
Here is some great info for getting up to speed with the basics of QGIS.
Set up Mergin Maps with QGIS on your laptop:
Follow the instruction to sign up for a free mergin account.
Make sure you have the latest version of QGIS installed.
Install the Mergin Maps plugin.
We will send you an invitation to join the
newgraphMergin workspace.
3.1.2 View projects in QGIS
- Switch to the
newgraphworkspace in QGIS following these instructions. Our project will show up in theMergin Mapstab of theBrowserwindow.
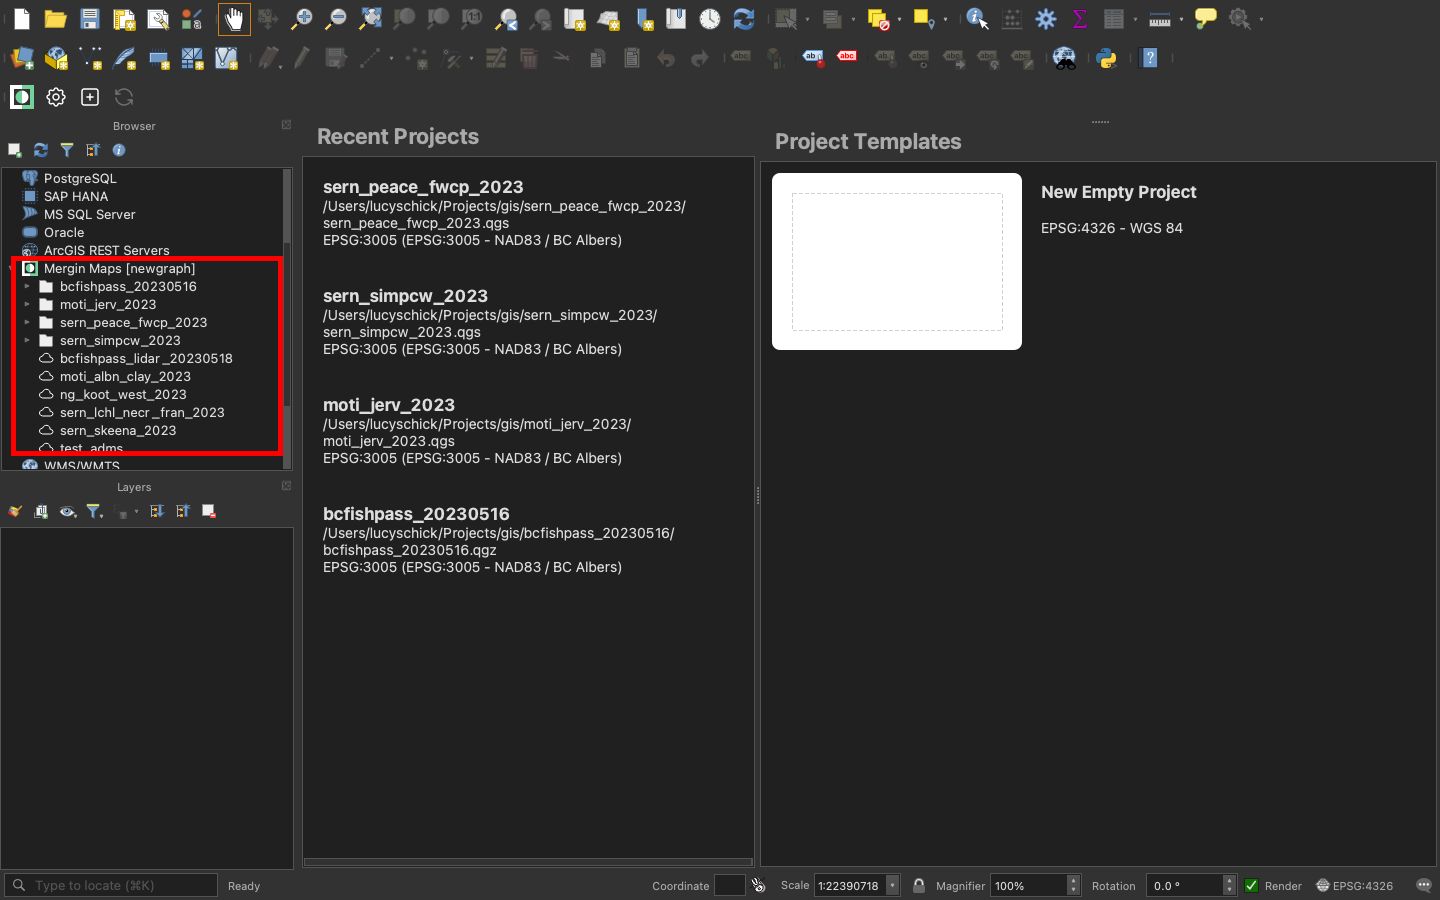
Figure 3.1: Viewing New Graph’s Mergin projects
Right click the project name and select
Download.Save the project somewhere appropriate. For New Graph employees this should be
Projects/gis.Double click or right click to open the project.
3.1.3 Common actions in QGIS
Below are some common actions we use in QGIS.
Most of the time we will have the attributes table open for a layer and will be navigating to features from there, you can find lots of information about working with attributes tables here.
- We use
themesto simplifying viewing projects. You can select athemeby clicking the “eye” icon inLayerspanel. You can also addthemesfollowing the instructions here.
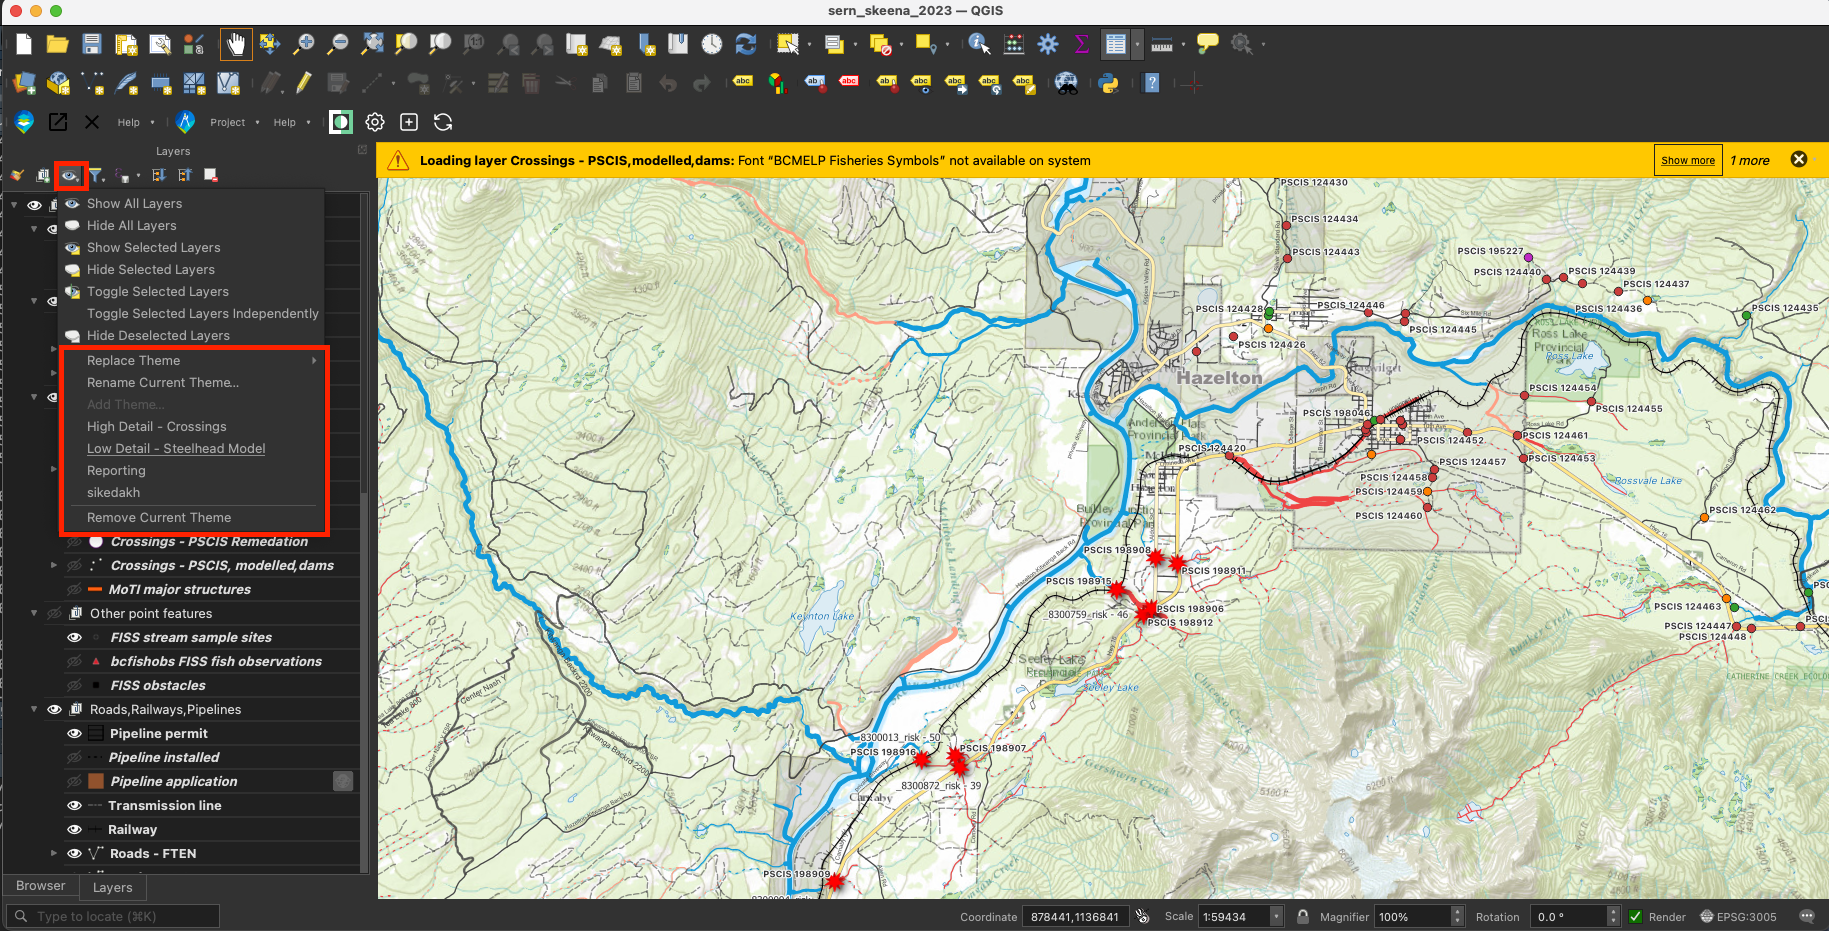
Figure 3.2: How select themes in QGIS
- Open the attributes table, and doc it so it is visible on the same screen as the map using the icon below.
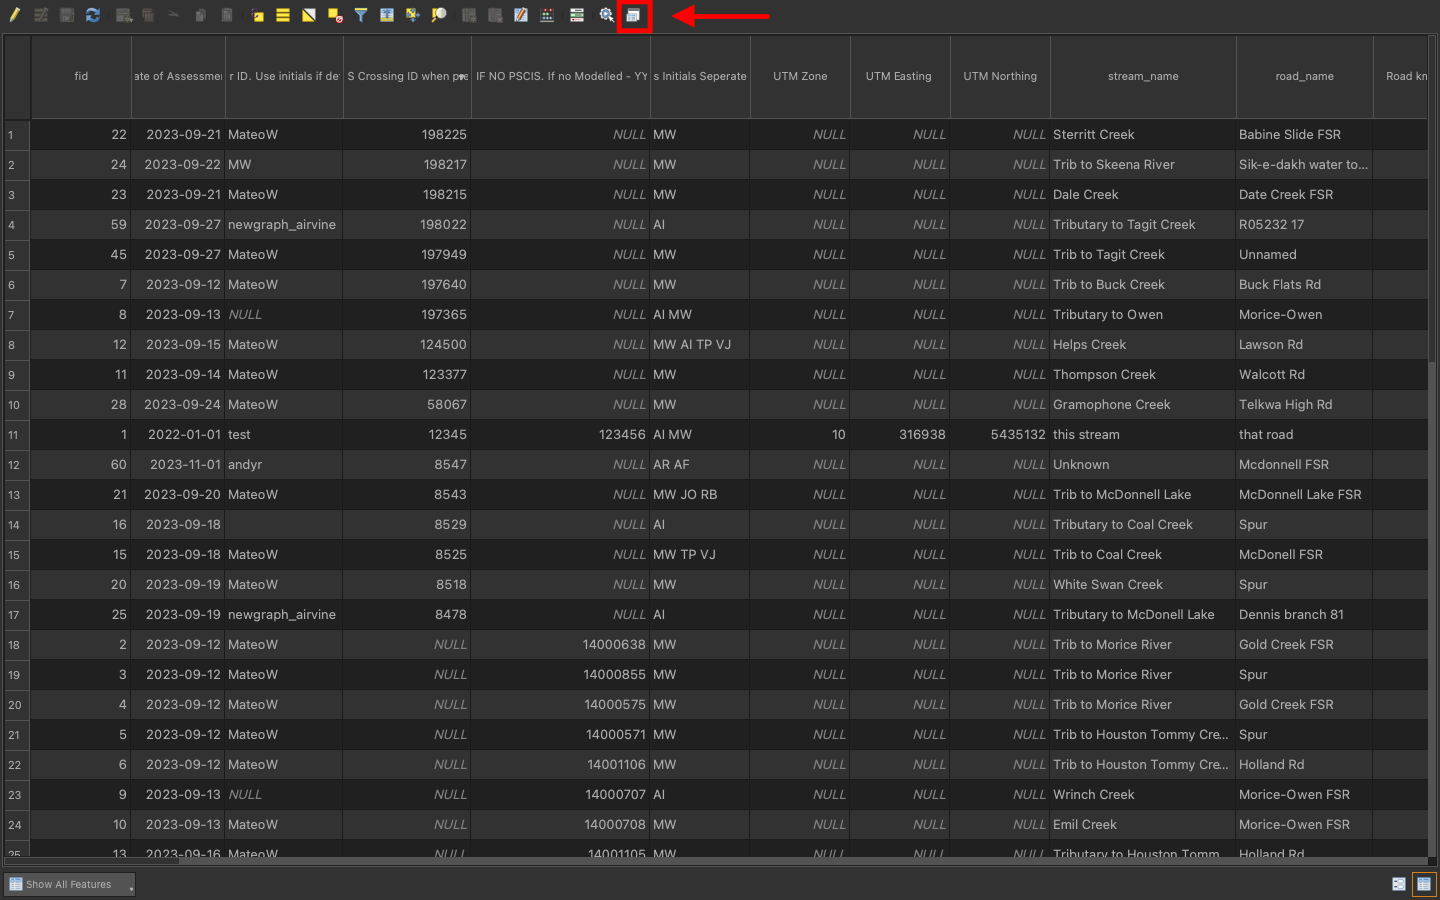
Figure 3.3: Select the ‘doc attributes table’ icon on the top right of the attributes table so it is visible on the same screen as the map
- Zoom to a feature from the attributes table by selecting the feature row in the table and then clicking
Zoom to featurelocated at the top of the attributes table. This will zoom to the feature on the map and highlight it in yellow.
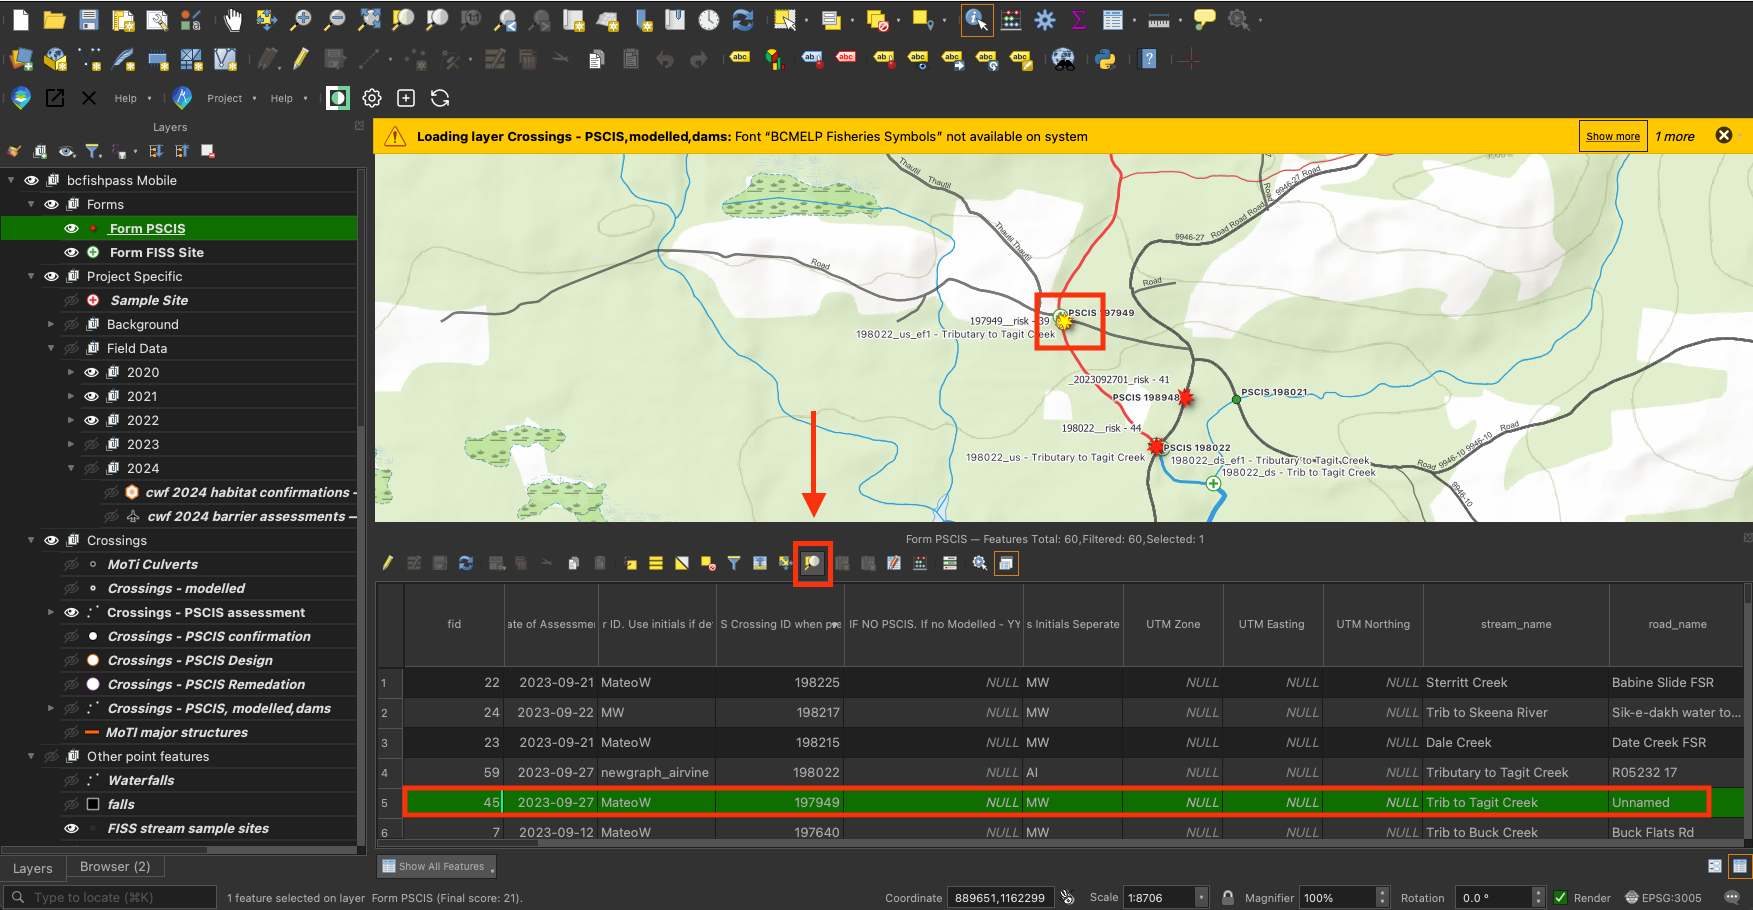
Figure 3.4: Zoom to a feature from the attributes table
- Finding a feature such as a culvert, stream, or else anything on the map. Use
Select feature by value. Then input your search term and selectzoom to feature, for example, looking for the site withsite_id = 15600301.
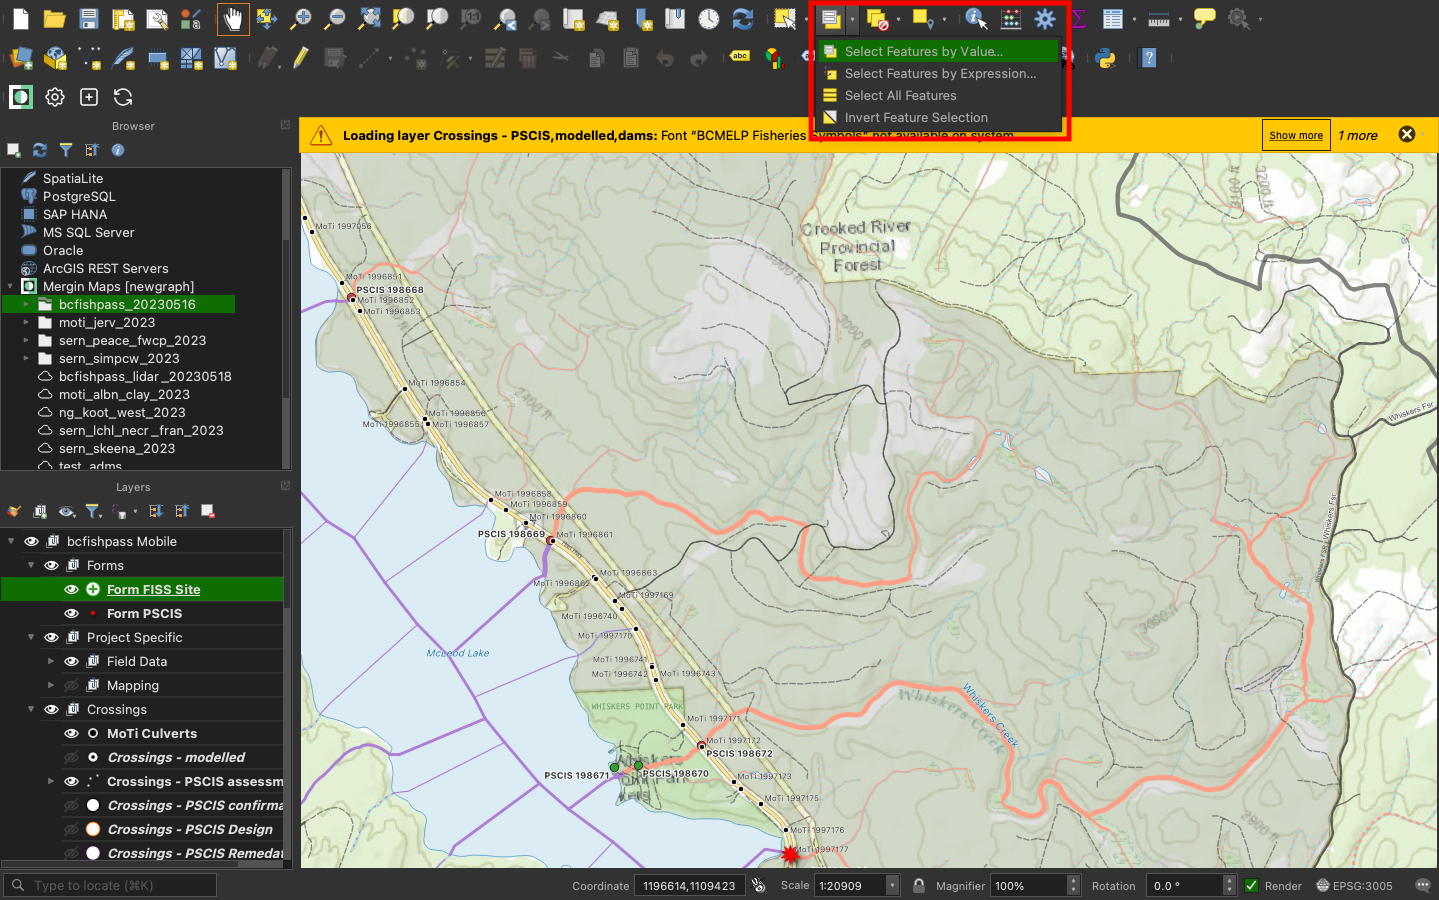
Figure 3.5: How to finding features in QGIS
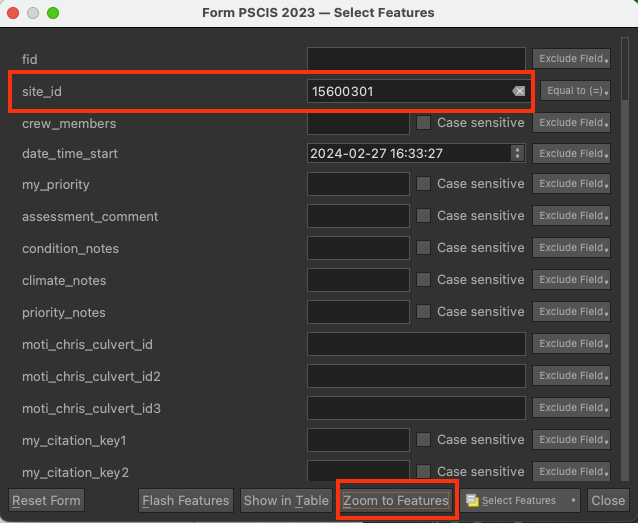
Figure 3.6: How to finding features in QGIS
- Getting information about a feature (“Identify Feature”). Make sure you have the layer selected in the
layerpanel, then select theIdentify Featurestool (top right) and click on the feature you want to know more about. TheIdentify Resultspanel will appear on the right.
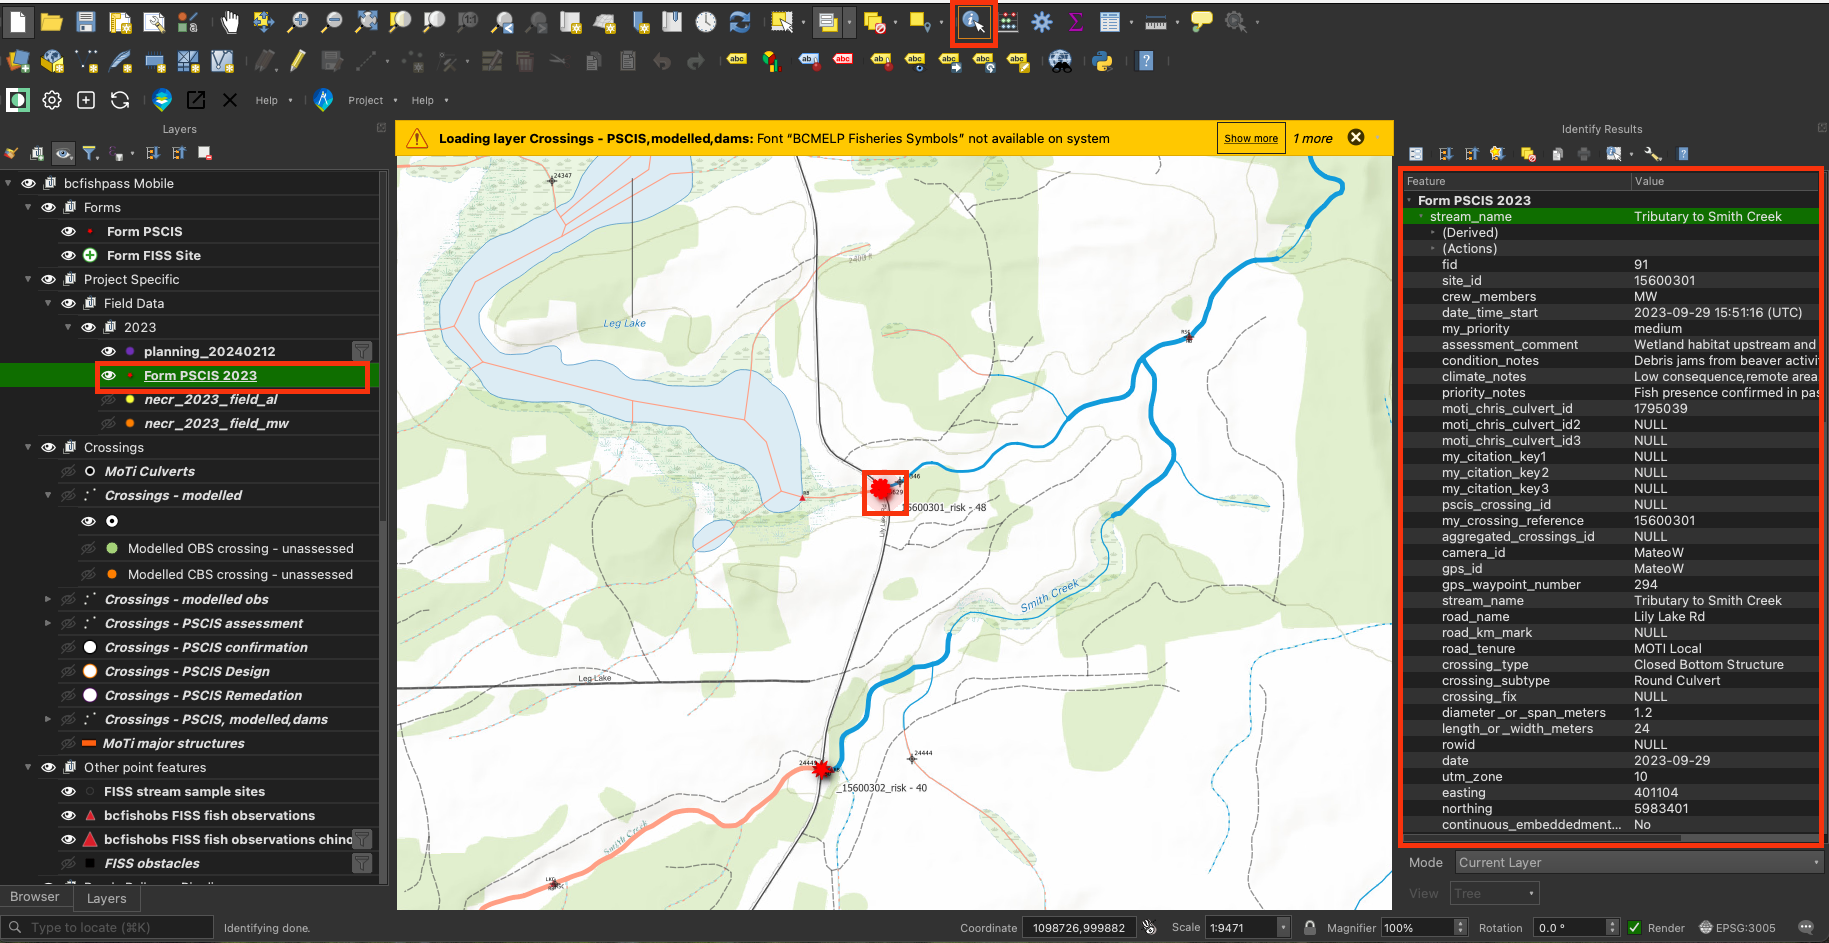
Figure 3.7: How to see feature info in QGIS
- Copy information from a feature. Select the row then hover your cursor over the text you want to copy then
cmd+cto copy (on mac).
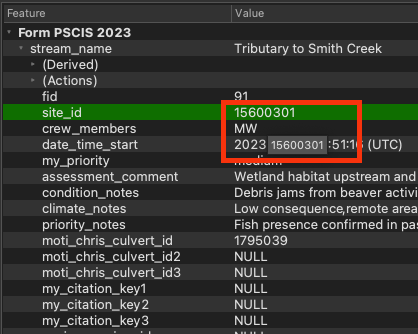
Figure 3.8: How to copy information from a features in QGIS
- View the digital field forms. Forms are available for many layer but we have created special categorized forms for the
form_pscisandform_fiss_sitelayers because these are the layers we add data (sites) to. Select one of these layers, use theIdentify Resultstool to pull up the crossing’s information, then click theformicon located in the top left corner of theIdentify Resultspanel. A new window will pop up with the form.
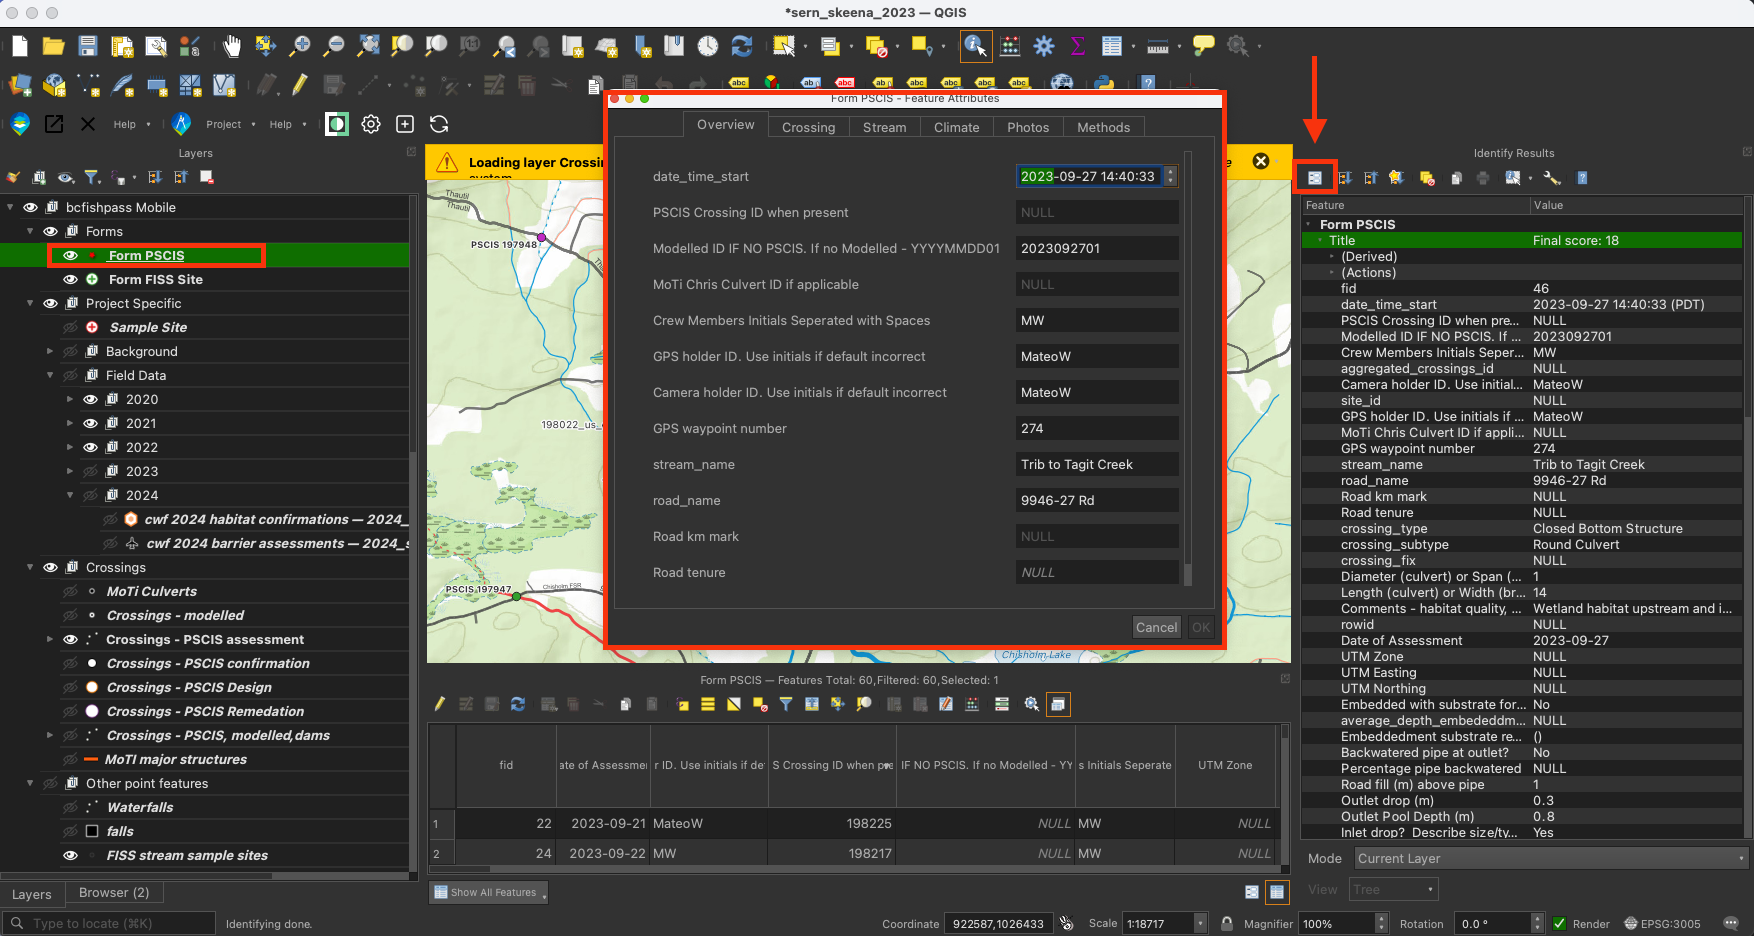
Figure 3.9: How to view the digital field form for either the form_pscis or form_fiss_site layers
- Measure a distance by selecting the ‘ruler’ icon located on the top right, then click two points to measure the distance between. A new window will pop up to show the distances.
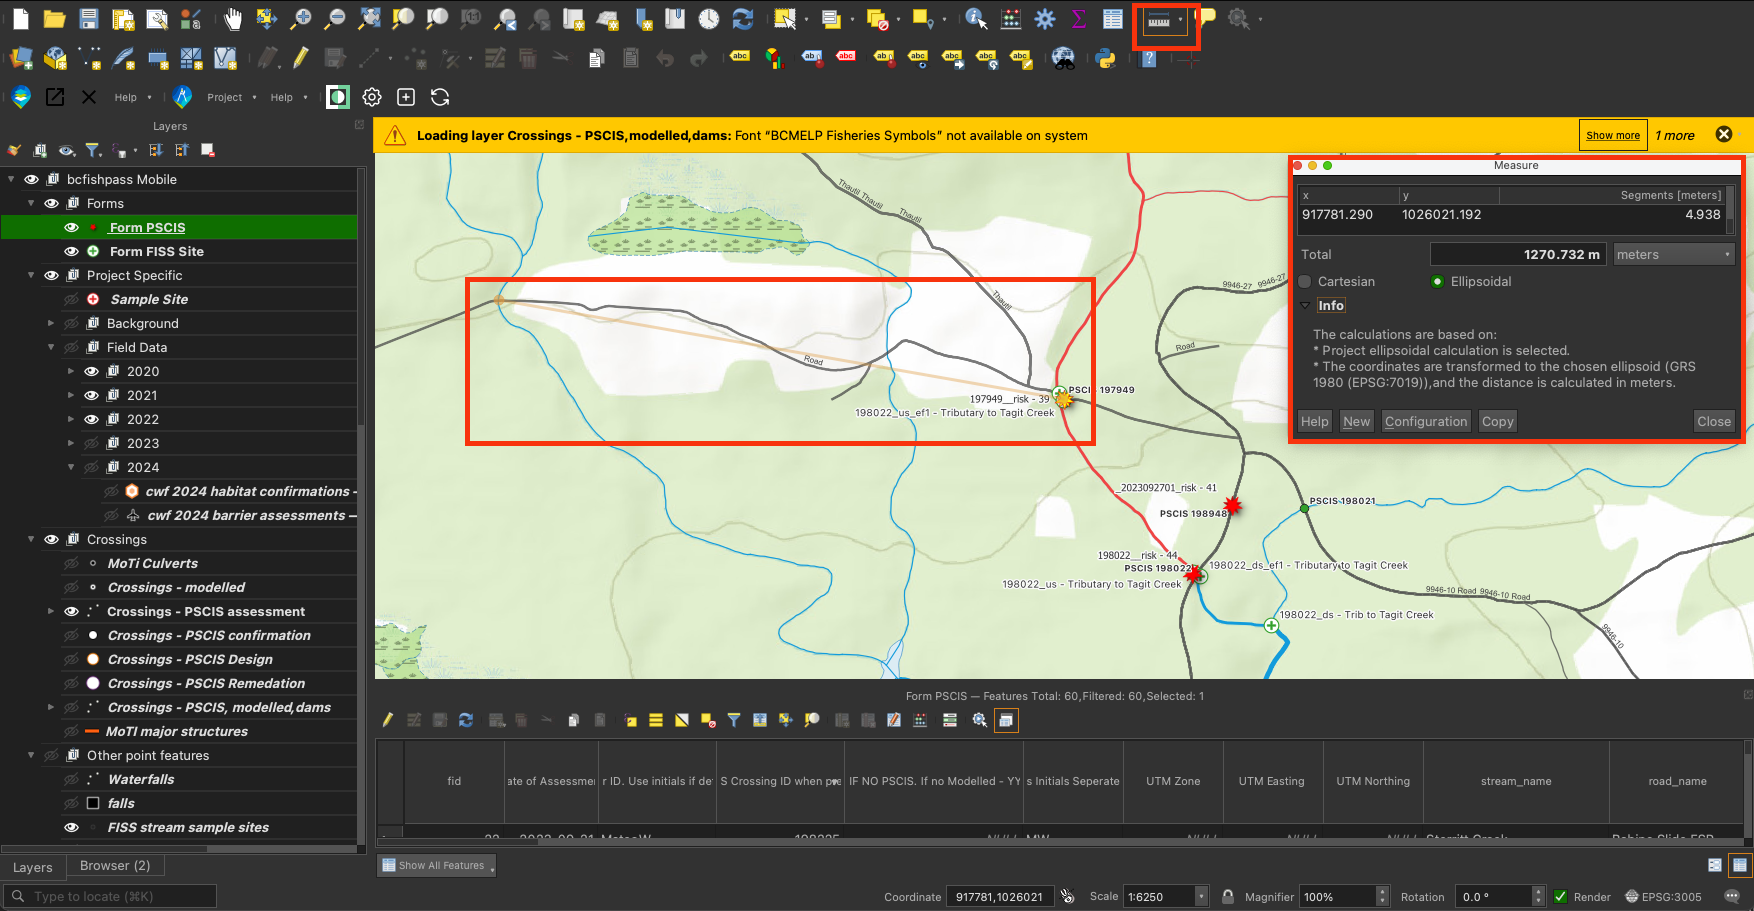
Figure 3.10: How to the distance between two points
- You can view photos from a previously assessed PSCIS site in QGIS by selecting the
Crossings - PSCIS assessmentlayer, using theIdentify Resultstool to pull up the crossing’s information, then clicking the link from theimage_view_urlfield. It will then direct you to a web-page with the site photos.
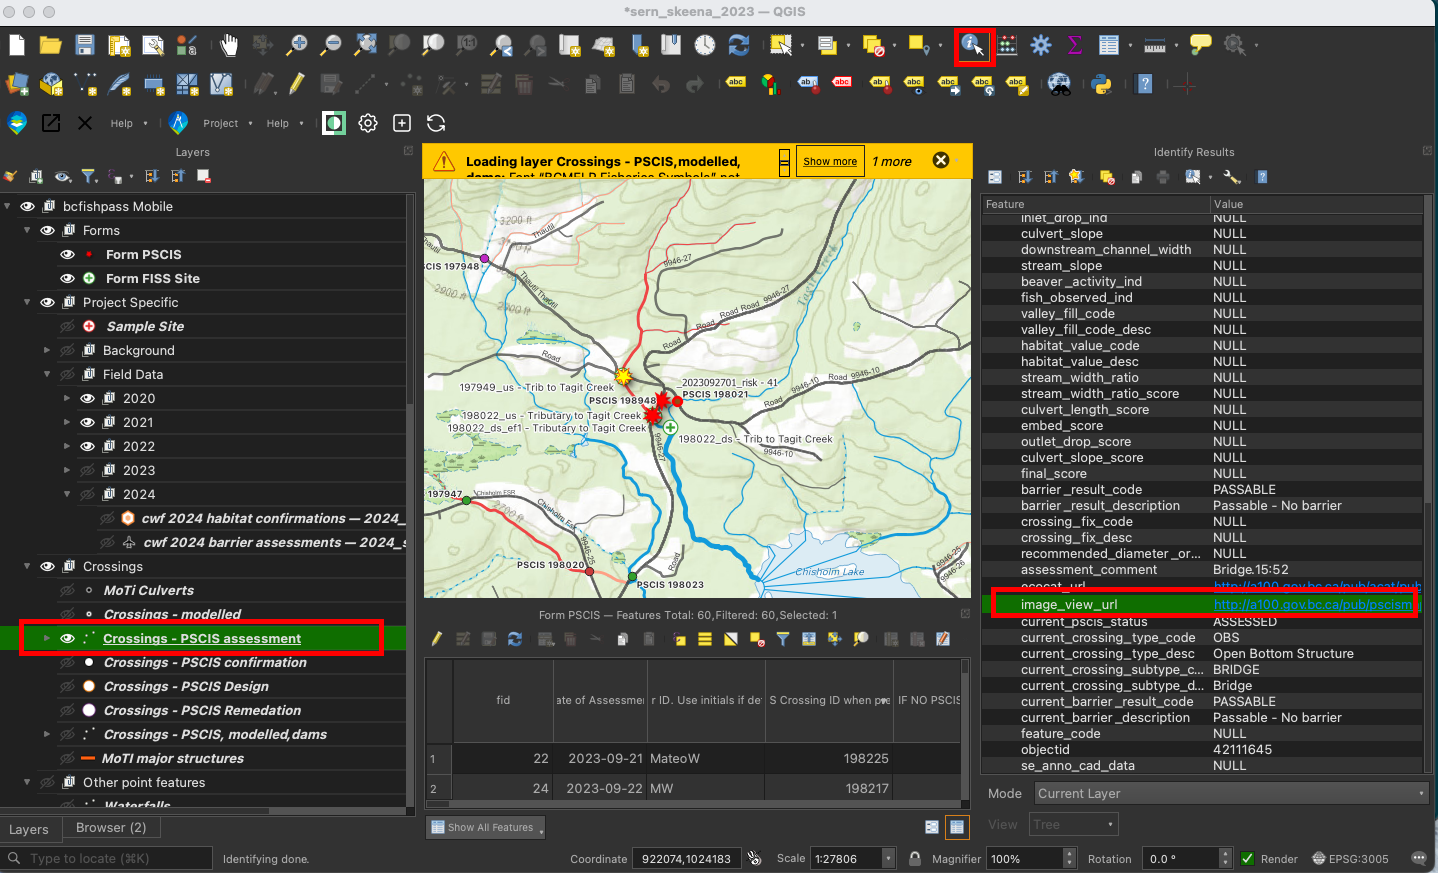
Figure 3.11: Access photos from a previously assessed PSCIS crossing
3.1.4 Editing a Feature
If for some reason you need to add or edit features (this doesn’t happen that often), you can do so by following the instructions here.
Make sure to sync the project following these instructions before to ensure that you have the most up to date version of the project (others may have edited the project since you last opened it) and after so that other team members will see to your updates.
3.2 Background planning
Before heading out into the field, we research the area we will be going to by visualizing the area on QGIS. We want to understand all we can about a site before arriving there.
Here are some things to investigate for a site, with the corresponding layer on QGIS:
- All
Crossings - PSCISlayers - Has the crossing been assessed before? What was it ranked as? Are there other crossings upstream or downstream and have they been assessed? Land Ownership- who owns the land. Is the crossing on private land, is it even accessible?bcfishobs FISS fish observations- have there been fish observed upstream or downstream in the past?FISS obstacles- are there barriers to fish passage noted on the stream?habitat models- is the stream modeled at suitable habitat for the target species?- What type of habitat is upstream/downstream? Use layers within
Basemapsection Google Satellite,Bing Aerial- is there a stream or crossing present?- How will you access the crossing? Which roads will you take? How far of a walk will it be from your vehicle to the crossing (use measuring tool on QGIS)