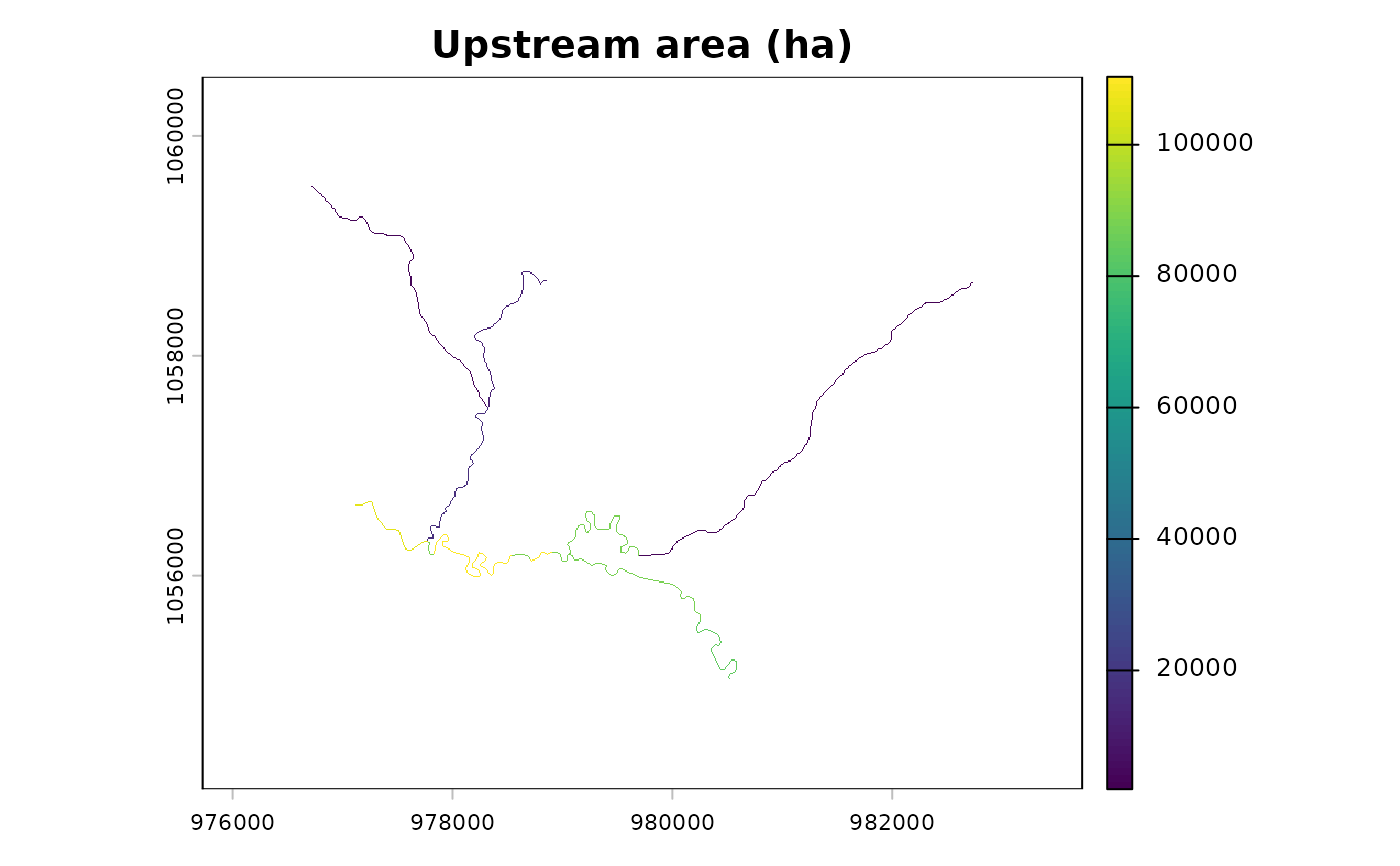
Burns stream line features onto the grid defined by a template raster.
Each stream cell receives the value of field (typically upstream
contributing area or channel width); non-stream cells are NA.
Arguments
- streams
An
sflinestring object with the stream network.- template
A
SpatRasterthat defines the output grid (extent, resolution, CRS). Typically the DEM.- field
Character. Column name in
streamsto use as the cell value. Must be numeric. Default"channel_width". The default is not interchangeable with what the flood model needs — see the note below.
Value
A SpatRaster with the same grid as template. Stream cells carry
the value of field; all other cells are NA.
Details
Rasterization uses terra::rasterize() with touches = FALSE (only cells
whose centre falls on a stream line are burned). When multiple features
overlap a cell, the maximum value is kept.
The output CRS matches template. If streams and template have
different CRS, streams is reprojected to match.
Which column, and why it matters
This function is deliberately generic: any numeric column rasterizes, and the
output layer takes the column's name. The hazard is downstream. When the
result is destined for the flood model — fl_flood_surface(), and so
fl_flood_model() and fl_valley_confine() — the values are read as
upstream contributing area in hectares, the drainage-area term of the
bankfull regression. Any other positive numeric column is accepted there
without complaint and returns a smaller flood surface with no error and no
warning, so pass field = "upstream_area_ha" for that path. The
"channel_width" default is for generic rasterizing, including the
channel_buffer DEM correction, which never touches the regression.
See also
fl_flood_surface() and fl_valley_confine(), which read this
function's output as drainage area in hectares.
Examples
dem <- terra::rast(system.file("testdata/dem.tif", package = "flooded"))
streams <- sf::st_read(
  system.file("testdata/streams.gpkg", package = "flooded"),
  quiet = TRUE
)
stream_r <- fl_stream_rasterize(streams, dem, field = "upstream_area_ha")
terra::plot(stream_r, main = "Upstream area (ha)")