Tributary to Missinka River - 125179 - Appendix
Site Location
PSCIS crossing 125179 is located on a Tributary to Missinka River , between kilometer 3 and 4 of Chuchinka-Missinka FSR, in the Parsnip River watershed group. The crossing is located approximately 660m east of PSCIS crossing 125180 and joins this adjacent stream just before emptying into the Missinka River, approximately 1km downstream. At the crossing location, the road is the responsibility of Sinclar Forest Group R01821 51A.
Background
At the crossing location, Tributary to Missinka River is a second order stream and drains a watershed of approximately 4.3km2. The watershed ranges in elevation from a maximum of 1876m to 799m near the crossing (Table 5.1).
In 2018, the Missinka River watershed was designated as a fisheries sensitive watershed under the authority of the Forest and Range Practices Act due to significant downstream fisheries values and watershed sensitivity (Beaudry 2013b). Special management is required in the crossing’s watershed to protect habitat for bull trout and arctic grayling and includes measures (among others) to limit equivalent clearcut area, reduce impacts to natural stream channel morphology, retain old growth attributes and maintain fish habitat/movement.
The site was originally prioritized for replacement in 2019 by Irvine (2020), following a habitat confirmation assessment which can be found here. In the summer of 2022, Sinclar Forest Group replaced the crossing with a 15m steel girder permanent bridge with modular timber decks (Irvine and Winterscheidt 2023). In addition to Irvine (2020) - post-replacement documentation regarding this crossing can also be found in the 2022 report here. A map of the watershed is provided in map attachment 093I.116.
fpr::fpr_table_wshd_sum(site_id = my_site) |>
  fpr::fpr_kable(caption_text = paste0('Summary of derived upstream watershed statistics for PSCIS crossing ', my_site, '.'),
           footnote_text = 'Elev P60 = Elevation at which 60% of the watershed area is above',
scroll = F)| Site | Area Km | Elev Site | Elev Min | Elev Max | Elev Median | Elev P60 | Aspect |
|---|---|---|---|---|---|---|---|
| 125179 | 4.3 | – | 799 | 1876 | 1306 | 1213 | SSW |
| * Elev P60 = Elevation at which 60% of the watershed area is above |
Monitoring
Effectiveness Monitoring Checklist
Monitoring results gathered on a effectiveness monitoring checklist are summarised in Table 5.2. In general - the structure appeared stable with no maintenance required at the time of reporting. Lessons learned from the work - to be leveraged towards future projects - include reducing the amount of riprap material placed within the bankfull channel width and replanting of areas where riparian vegetation is removed during construction. Photos showing a comparison of the culvert assessment conducted in 2019 versus the completed bridge construction in 2024 are presented in Figures 5.2 - 5.3.
tab_monitoring |>
  dplyr::filter(`Pscis Crossing Id` == my_site) |>
  dplyr::mutate(across(everything(), as.character)) |>
  tidyr::pivot_longer(
    cols = everything(),  # Select all columns
    names_to = "variable",  # Column names become values in this column
    values_to = "value"  # Data values go into this column
  ) |>
  fpr::fpr_kable(caption_text = paste0('Summary of monitoring metric results for site ', my_site, '.'),
scroll = gitbook_on)| variable | value |
|---|---|
| Pscis Crossing Id | 125179 |
| Stream Name | Tributary to Missinka River |
| Road Name | Chuchinka-Missinka FSR |
| Crossing Subtype | BRIDGE |
| Span | 15 |
| Width | 4.8 |
| Assessment Comment |
Monitoring visit conducted. Electrofishing was performed upstream and downstream, with all fish >60mm tagged. See camera roll for additional photos. Recommend bringing old photos as a reference to recreate photo angles and shutter length. |
| Dewatering Notes | No dewatering |
| Velocity Notes | Velocity was higher under the bridge than both upstream and downstream due to channel constriction from riprap. |
| Constriction Notes | Channel width measurements beneath the structure within the road right-of-way were 2.9m, 3.5m, and 2.5m, which were narrower than the typical channel width observed both upstream and downstream, as noted on the fish site cards. |
| Substrate Notes | A significant amount of riprap material was present within the channel in the road right-of-way. Occasional pieces of riprap were functioning to create step-pool habitat downstream. Overall, the substrate under the structure was slightly larger than that observed both upstream and downstream. |
| Riparian Notes | There did not appear to have been any riparian planting conducted during construction, with only herbaceous regrowth observed, including grasses and fireweed. The site could have been planted with willow whips to provide cover and food. |
| Flow Depth Notes | Flow depth was comparable to sections downstream, with measured depths ranging from 5–20cm. At the observed flow levels during the survey, migration was not likely hindered. |
| Stability Notes | The structure and extensive rock riprap appeared fully stable, with no evidence of slumping or instability. |
| Revegetation Notes | As noted in the riparian section, the construction footprint was vegetated primarily with herbaceous plants where rock was not present. |
| Cover Notes | Due to the extensive rock placement within the construction footprint, there was no overhanging vegetation cover. However, occasional pieces of riprap and boulder lines within the channel provided some boulder and step-pool habitat. The larger substrate was providing fish habitat, as observed during electrofishing. |
| Maintenance Notes | It appears that no maintenance is required at this time. |
Fish Sampling
Electrofishing was conducted downstream and upstream of the PSCIS crossing 125179 with results summarised in Tables 5.3 - 5.4 and Figure 5.1. A total of 15 rainbow trout were captured downstream and 12 rainbow trout were captured upstream of crossing 125179 (Figures 5.4 - 5.5).
As per recommendations in Irvine (2020) and Irvine and Winterscheidt (2023) - to provide reference site data for comparison, electrofishing was conducted not only at the site of the remediation (PSCIS 125179) - but also at PSCIS crossing 125180, a similarly sized culverted stream - located approximately 660m east of the subject crossing (Irvine and Winterscheidt 2023; Irvine 2020). Another site (PSCIS crossing 125186) was also scoped as a potential reference site - however the stream was almost completely dry in 2024 (with the exception of the outlet pool and intermittent shallow pool sections).
Upstream on the reference site (125180_us_ef1) - fish lengths and weights were recorded, and all fish with a fork length greater than 60mm were tagged with Passive Integrated Transponders (PIT tags - data stored here. On the first sampling event downstream (125180_ds_ef1) - only species and length data was collected. However, the same site was revisited a few days later (125180_ds_ef2) with length/weight collected and PIT tagging conducted. Results are summarised in Tables 5.5 - 5.6 and Figure 5.1.
A total of 44 rainbow trout were captured downstream during the first sampling event (125180_ds_ef1), and 24 rainbow trout were captured upstream (Figures 5.6 - 5.7). During the second downstream sampling event (when PIT tagging was conducted - 125180_ds_ef2), a total of 28 rainbow trout were captured. The lower density of rainbow trout parr captured on the second round of sampling within the same section of stream is not surprising since disturbance of the site and handling of fish a few days earlier likely impacted the recapture rate.
# species captured downstream
tab_fish_summary |>
  dplyr::filter(site_id == paste0(my_site, '_ds')) |>
  dplyr::group_by(site_id) |>
  dplyr::distinct(species) |>
  dplyr::pull(species)

# species captured upstream
tab_fish_summary |>
  dplyr::filter(site_id == paste0(my_site, '_us')) |>
  dplyr::group_by(site_id) |>
  dplyr::distinct(species) |>
  dplyr::pull(species)
Conclusion
Fish passage at crossing 125179 was restored in the summer of 2022 with a 15m steel girder permanent bridge with modular timber decks. Partial funding for the project was provided by FWCP through coordination from SERNbc. Effectiveness monitoring at the site was conducted in 2024 with the structure in stable condition with no maintenance required at the time of reporting. Lessons learned from the work - to be leveraged towards future projects - include reducing the amount of riprap material placed within the bankfull channel width and replanting of areas where riparian vegetation is removed during construction. This crossing serves as an example of a successful replacement, and the lessons learned through its implementation can help build stakeholder confidence in advancing additional fish passage remediation projects.
Resampling of fish at the restoration and reference sites in future years is recommended to build our understanding of fish use, movement and health in the subject streams. Acquisition of additional aerial imagery in the future is also recommended so that imagery and elevation models can be compared with data collected immediately following replacement (2022) to evaluate stream morphology changes and riparian recovery since construction.
| site | passes | ef_length_m | ef_width_m | area_m2 | enclosure |
|---|---|---|---|---|---|
| 125179_ds_ef1 | 1 | 35 | 3.7 | 129.5 | partial enclosure |
| 125179_us_ef1 | 1 | 40 | 2.4 | 96.0 | partial enclosure |
| local_name | species_code | life_stage | catch | density_100m2 | nfc_pass |
|---|---|---|---|---|---|
| 125179_ds_ef1 | Rainbow Trout | adult | 1 | 0.8 | FALSE |
| 125179_ds_ef1 | Rainbow Trout | fry | 2 | 1.5 | FALSE |
| 125179_ds_ef1 | Rainbow Trout | parr | 12 | 9.3 | FALSE |
| 125179_us_ef1 | Rainbow Trout | fry | 4 | 4.2 | FALSE |
| 125179_us_ef1 | Rainbow Trout | juvenile | 2 | 2.1 | FALSE |
| 125179_us_ef1 | Rainbow Trout | parr | 6 | 6.2 | FALSE |
|
* nfc_pass FALSE means fish were captured in final pass indicating more fish of this species/lifestage may have remained in site. Mark-recaptured required to reduce uncertainties. |
| site | passes | ef_length_m | ef_width_m | area_m2 | enclosure |
|---|---|---|---|---|---|
| 125180_us_ef1 | 1 | 35 | 2.3 | 80.5 | partial enclosure |
| 125180_ds_ef1 | 1 | 30 | 3.3 | 99.0 | partial enclosure |
| 125180_ds_ef2 | 1 | 30 | 3.3 | 99.0 | partial enclosure |
| local_name | species_code | life_stage | catch | density_100m2 | nfc_pass |
|---|---|---|---|---|---|
| 125180_ds_ef1 | Rainbow Trout | fry | 16 | 16.2 | FALSE |
| 125180_ds_ef1 | Rainbow Trout | juvenile | 3 | 3.0 | FALSE |
| 125180_ds_ef1 | Rainbow Trout | parr | 25 | 25.3 | FALSE |
| 125180_ds_ef2 | Rainbow Trout | adult | 1 | 1.0 | FALSE |
| 125180_ds_ef2 | Rainbow Trout | fry | 13 | 13.1 | FALSE |
| 125180_ds_ef2 | Rainbow Trout | juvenile | 2 | 2.0 | FALSE |
| 125180_ds_ef2 | Rainbow Trout | parr | 12 | 12.1 | FALSE |
| 125180_us_ef1 | Rainbow Trout | fry | 6 | 7.5 | FALSE |
| 125180_us_ef1 | Rainbow Trout | juvenile | 1 | 1.2 | FALSE |
| 125180_us_ef1 | Rainbow Trout | parr | 17 | 21.1 | FALSE |
|
* nfc_pass FALSE means fish were captured in final pass indicating more fish of this species/lifestage may have remained in site. Mark-recaptured required to reduce uncertainties. |
my_caption <- paste0('Densites of rainbow trout (fish/100m2) captured upstream and downstream of PSCIS crossings ', my_site, ' and ', my_site2, '. Note that two sampling events were conducted within the same sampling site on different days - downstream of site 125180')

# fish_abund |>
#   dplyr::filter(site %in% c(my_site, my_site2), species_code != "NFC") |>
#   ggplot2::ggplot(ggplot2::aes(x = location, y = density_100m2)) +
#   ggplot2::geom_boxplot(fill = "lightgray", color = "black", alpha = 0.7) +
#   ggplot2::geom_dotplot(binaxis = "y", stackdir = "center", dotsize = 0.8,
#                         fill = "black", color = "black", alpha = 0.7) +
#   ggplot2::facet_grid(species_code ~ life_stage, scales = "fixed") +
#   ggplot2::theme_light() +
#   ggplot2::theme(
#     legend.position = "none",
#     axis.title.x = ggplot2::element_blank()
#   ) +
#   ggplot2::ylab(expression(Density ~ (fish/100 ~ m^2)))

fish_abund |>
  dplyr::filter(site %in% c(my_site, my_site2), species_code != "NFC") |>
  ggplot2::ggplot(ggplot2::aes(x = location, y = density_100m2, color = local_name, fill = local_name)) +
  ggplot2::geom_boxplot(fill = "lightgray", color = "black", alpha = 0.7) +
  ggplot2::geom_dotplot(binaxis = "y", stackdir = "center", dotsize = 0.8) +
  ggplot2::facet_grid(site ~ life_stage, scales = "fixed") +
  ggplot2::theme_light() +
  ggplot2::theme(
    legend.position = "right",  # Adds the legend
    axis.title.x = ggplot2::element_blank()
  ) +
  ggplot2::ylab(expression(Density ~ (fish/100 ~ m^2)))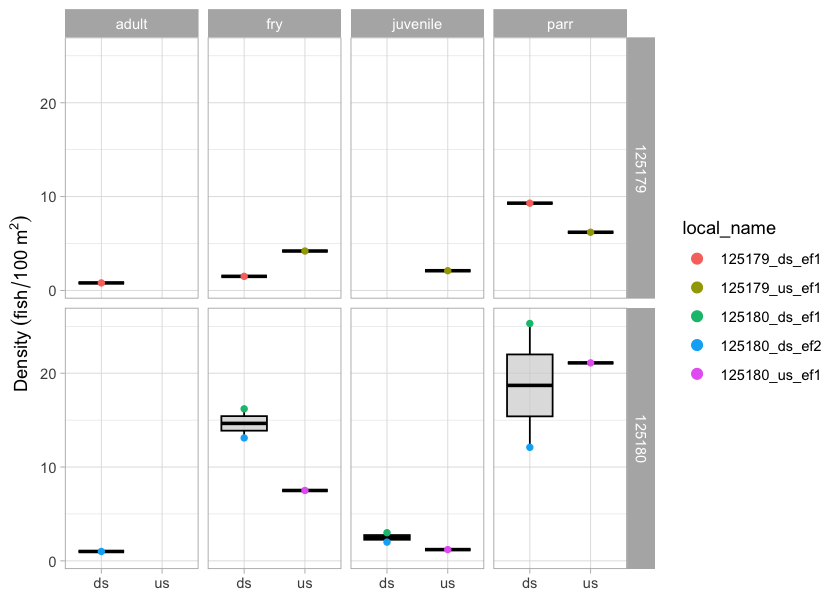
Figure 5.1: Densites of rainbow trout (fish/100m2) captured upstream and downstream of PSCIS crossings 125179 and 125180. Note that two sampling events were conducted within the same sampling site on different days - downstream of site 125180
my_photo1 = fpr::fpr_photo_pull_by_str(str_to_pull = 'crossing_all_2019')

my_caption1 = paste0('Photos of crossing ', my_site, ' in 2019.')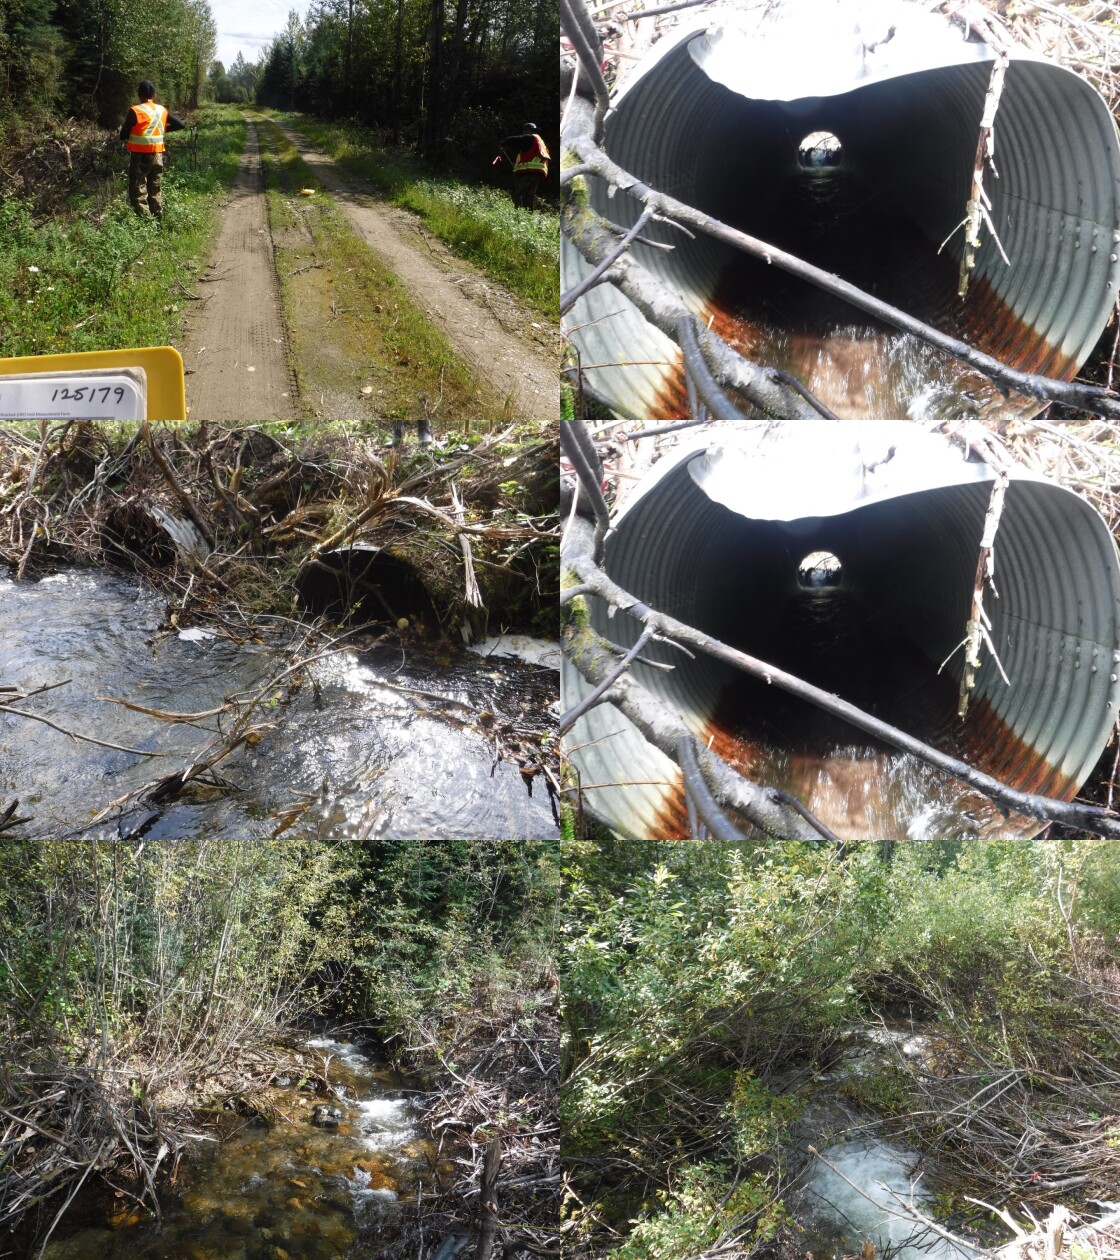
Figure 5.2: Photos of crossing 125179 in 2019.
my_photo2 = fpr::fpr_photo_pull_by_str(str_to_pull = 'crossing_all_2024')

my_caption2 = paste0('Photos of crossing ', my_site, ' in 2024.')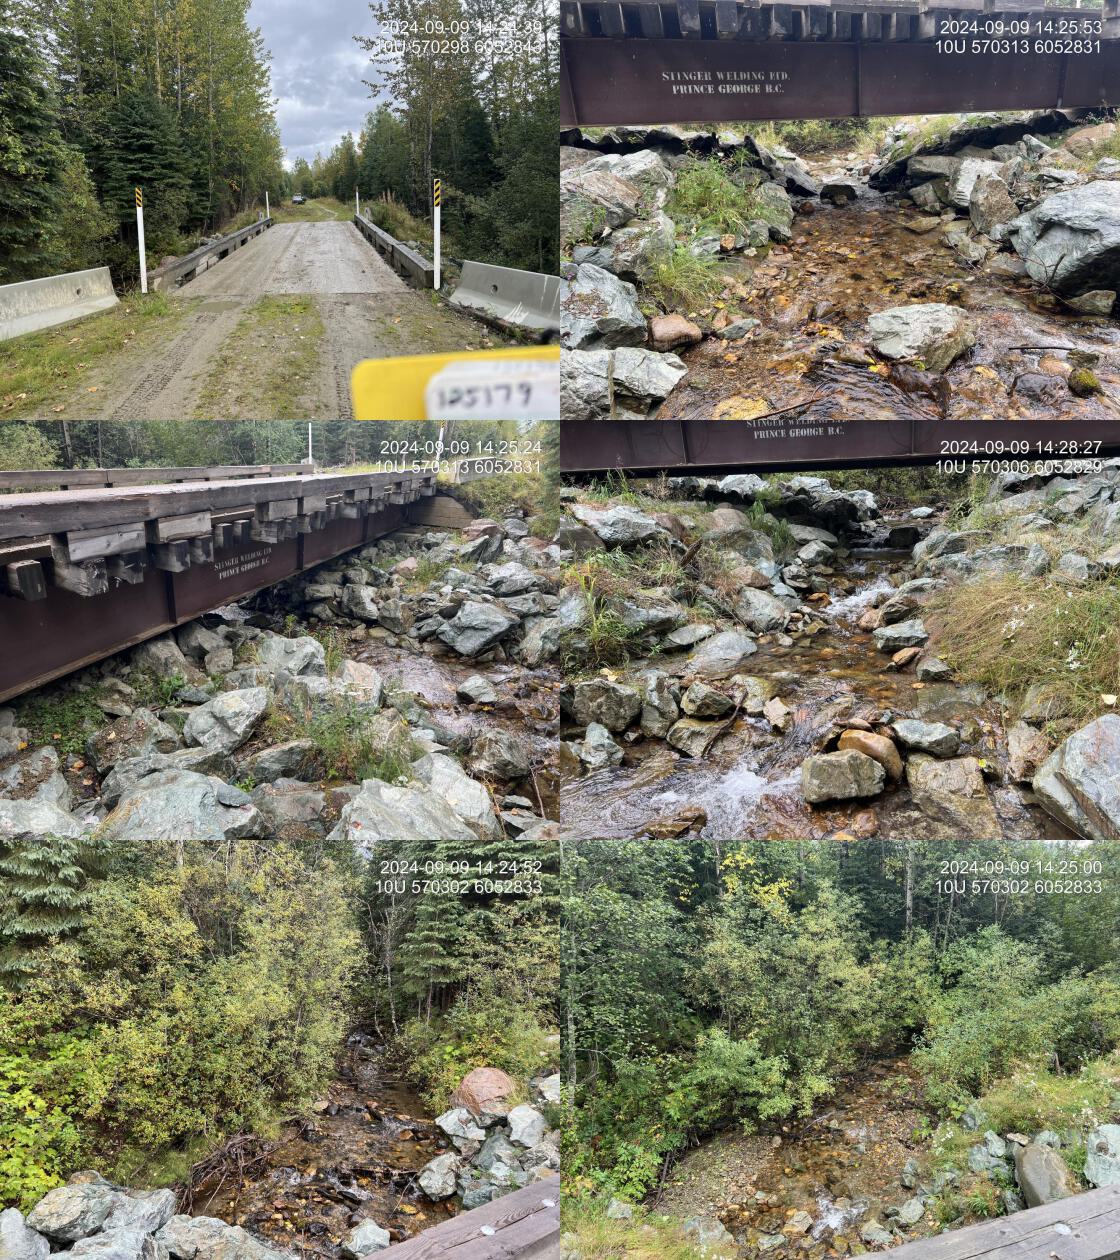
Figure 5.3: Photos of crossing 125179 in 2024.
my_caption <- paste0('Left: ', my_caption1, ' Right: ', my_caption2)

knitr::include_graphics(my_photo1)
knitr::include_graphics("fig/pixel.png")
knitr::include_graphics(my_photo2)
my_photo1 = fpr::fpr_photo_pull_by_str(str_to_pull = 'us_ef1_typical_1')
my_caption1 = paste0('Typical habitat electrofished upstream of PSCIS crossing ', my_site, '.')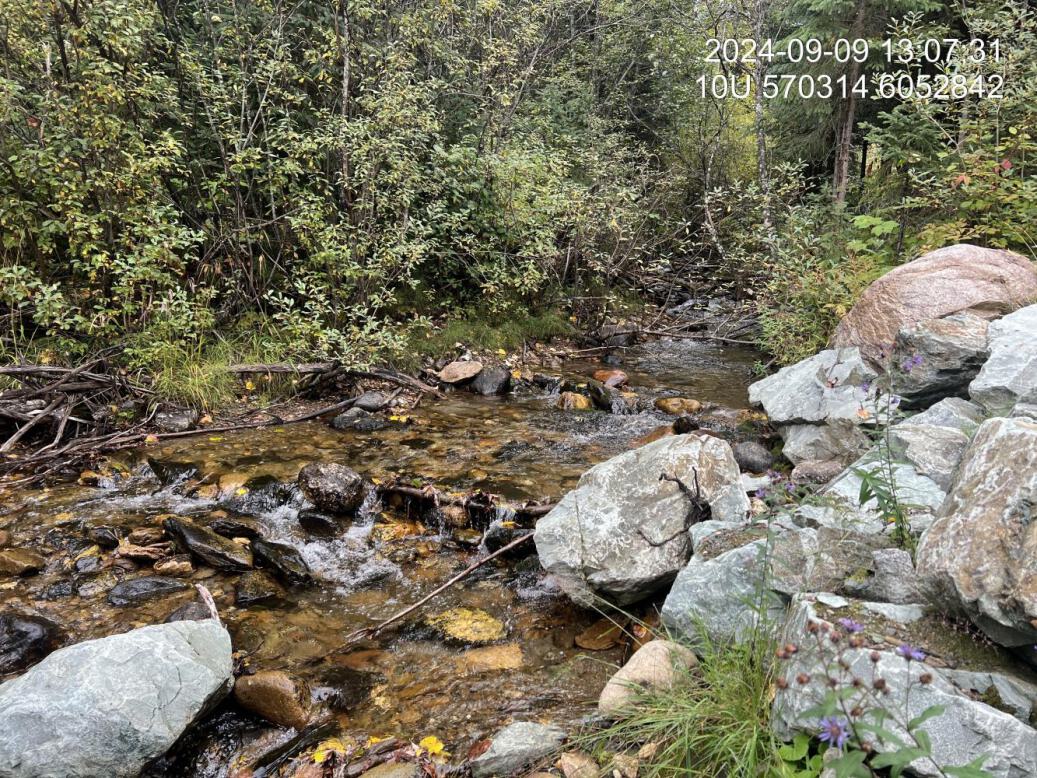
Figure 5.4: Typical habitat electrofished upstream of PSCIS crossing 125179.
my_photo2 = fpr::fpr_photo_pull_by_str(str_to_pull = 'fish2')

my_caption2 = paste0('Rainbow trout captured upstream of PSCIS crossing ', my_site, '.')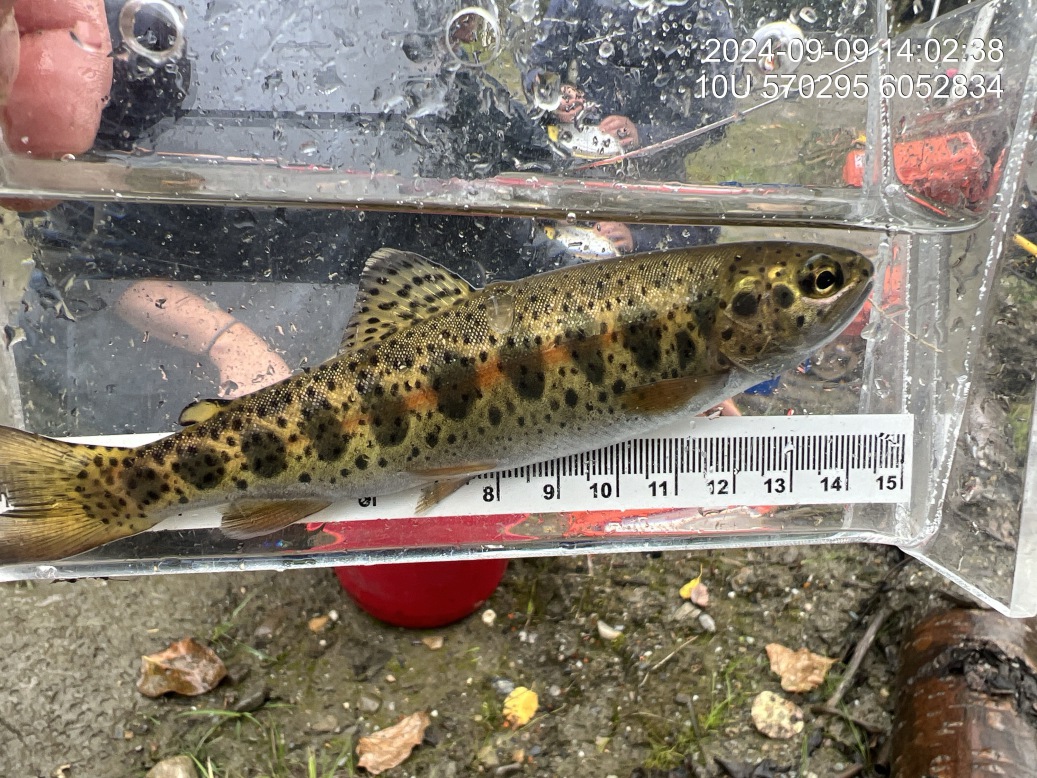
Figure 5.5: Rainbow trout captured upstream of PSCIS crossing 125179.
my_caption <- paste0('Left: ', my_caption1, ' Right: ', my_caption2)

knitr::include_graphics(my_photo1)
knitr::include_graphics("fig/pixel.png")
knitr::include_graphics(my_photo2)
my_photo1 = fpr::fpr_photo_pull_by_str(site = my_site2, str_to_pull = 'ef_us_')
my_caption1 = paste0('Typical habitat electrofished upstream of PSCIS crossing ', my_site2, '.')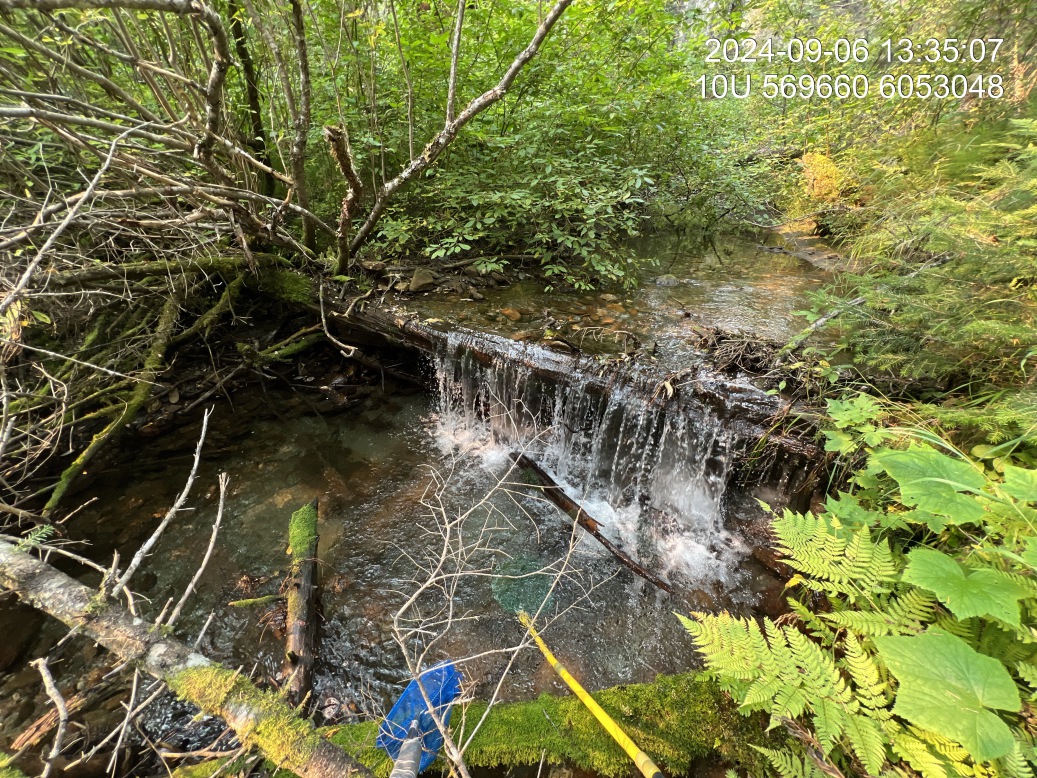
Figure 5.6: Typical habitat electrofished upstream of PSCIS crossing 125180.
my_photo2 = fpr::fpr_photo_pull_by_str(site = my_site2, str_to_pull = 'fish1')

my_caption2 = paste0('Rainbow trout captured upstream of PSCIS crossing ', my_site2, '.')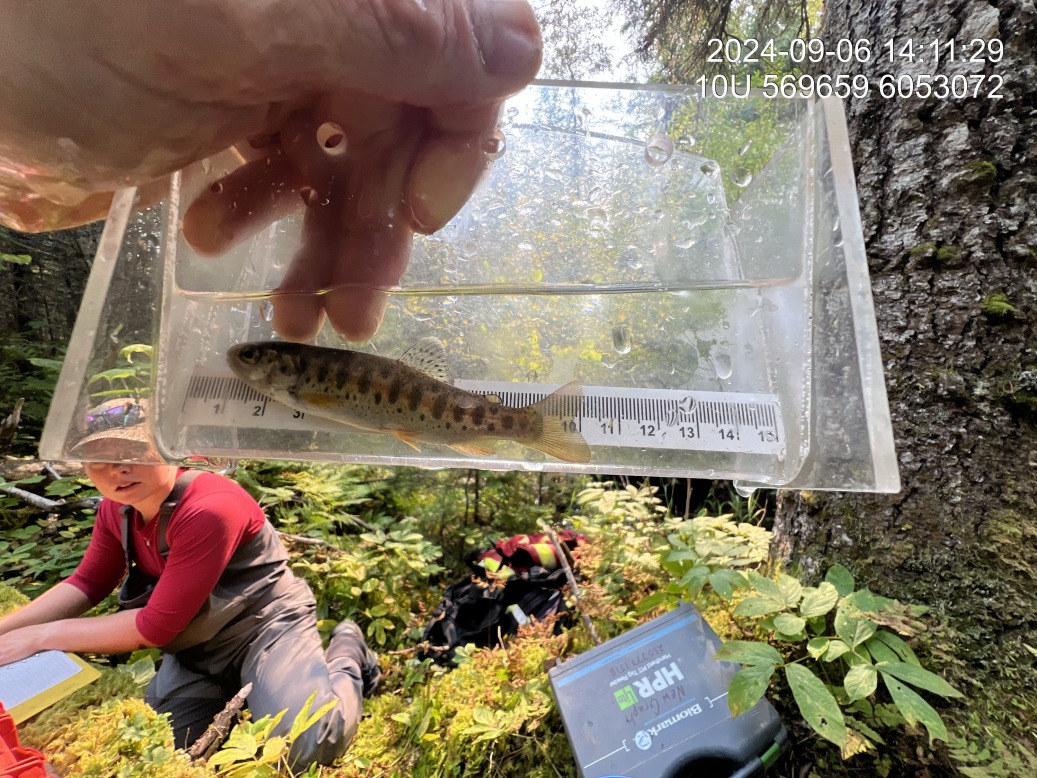
Figure 5.7: Rainbow trout captured upstream of PSCIS crossing 125180.
my_caption <- paste0('Left: ', my_caption1, ' Right: ', my_caption2)

knitr::include_graphics(my_photo1)
knitr::include_graphics("fig/pixel.png")
knitr::include_graphics(my_photo2)