2 Background
2.1 Wet’suwet’en Governance
The Wedzin Kwa watershed lies within the Yintah of the Wet’suwet’en people, who have governed these lands and waters through their hereditary chief system for thousands of years. The Wet’suwet’en are a matrilineal society organized into five clans — Gilseyhu (Big Frog), Laksilyu (Small Frog), Tsayu (Beaver), Gitdumden (Wolf/Bear), and Laksamshu (Fireweed) — with thirteen house groups (yikh) managing 38 distinct territories. Inuk Nu’at’en (Wet’suwet’en law) governing the harvesting of fish and management of the Yintahk (Land) are founded on values developed over thousands of years of social, subsistence, and environmental dynamics (Office of the Wet’suwet’en 2013; M. H. Morin 2016). The Delgamuukw-Gisday’wa Supreme Court decision (1997) affirmed that Wet’suwet’en Aboriginal title had not been extinguished, and the Office of the Wet’suwet’en continues to assert governance over watershed management and fisheries within their territories (Harris 2011).
2.2 Land Use and Water Quality
The Neexdzii Kwa has experienced intensive land-use transformation including agriculture, forestry, and linear infrastructure development, and has been noted as containing some of the most intense land use in the Skeena Basin (A. Gottesfeld and Rabnett 2007). Water quality concerns centre on nutrient enrichment, point-source contamination, legacy mine drainage, and thermal stress. Remington and Donas (2000) found that the watershed’s glacial-fluvial and glacial-lacustrine soils have unusually high soluble phosphorus concentrations relative to other Skeena streams, making the system vulnerable to eutrophication from nitrogen loading linked to agriculture, septic systems, and livestock. Periphyton biomass near Houston averaged 145 mg/m² chlorophyll-a (1996–1999), with increasing filamentous green algae indicative of nutrient enrichment. Nijman (1996) established water quality objectives for the Bulkley River headwaters in the context of acid mine drainage from the Equity Silver Mine, where ongoing lime treatment of waste rock is expected to be required for over 100 years. More recent monitoring confirmed that water temperature and dissolved oxygen remain the parameters most frequently exceeding BC Water Quality Guidelines, while total phosphorus was notably absent from the 2017 sampling program (Oliver 2020). A six-year continuous temperature monitoring program documented mainstem temperatures exceeding optimal thresholds for chinook and sockeye salmon (Westcott 2022). Pacific salmon have additional ecological importance beyond their own life histories: returning adults historically delivered substantial marine-derived nitrogen and phosphorus to Skeena tributaries via spawning carcass decomposition, fueling freshwater and riparian productivity. The Upper Bulkley once supported significant chinook and sockeye returns (A. S. Gottesfeld and Rabnett 2008) that have declined, reducing this natural nutrient input pathway over the same period that anthropogenic inputs have grown. This shift provides essential context for interpreting present-day bioassessment results.
Potential point sources of nutrient and contaminant loading include the Houston wastewater treatment plant, the Knockholt Landfill, legacy contamination associated with the Equity Silver Mine on Bessemer Creek (a Buck Creek tributary, not on the mainstem) where ongoing lime treatment of waste rock is expected to be required for over 100 years (Nijman 1996), and the Richfield Loop concentrate shed site near Topley where between 1972 and 1982 copper-sulphide concentrates from Noranda’s Bell and Granisle mines were stored at two transfer stations close to the Bulkley River (A. S. Gottesfeld and Rabnett 2008). K. A. Morin and Hutt (2000) conducted aquatic studies and concluded that water quality and aquatic life were receiving insignificant impacts despite the relatively large volumes of contaminated soils; however, Price (2014) noted that the site should be re-assessed to ensure it is no longer a habitat concern. Several tributaries have also been documented as highly or severely degraded due to agricultural, municipal, and transportation impacts, including Richfield Creek, Byman Creek, and McQuarrie Creek (Mitchell 1997). A spatial query of BC Environmental Monitoring System (EMS) stations within the watershed boundary identified over 100 stations with historical records spanning 1972–2024 (Appendix B). Remington and Donas (2000) recommended a long-term monitoring strategy incorporating water quality, periphyton, and benthic invertebrate bioassessment.
2.3 Previous Benthic Monitoring
Benthic invertebrate bioassessment in the Skeena basin has been conducted within the CABIN Reference Condition Approach (RCA) framework. Perrin et al. (2007) established the original Skeena RCA model using 86 reference sites and 170 test sites across north-central BC, and Bennett (2011) revised the model with an expanded dataset of 145 reference sites classified into four groups using six landscape-level predictor variables (percent ice, January precipitation, percent wetlands, percent intrusive rock, January snowfall, and percent lakes). The revised model achieved 77% classification accuracy and has been applied by the BC Ministry of Environment Skeena Region for impact assessment near landfills, agriculture, mining, and other anthropogenic activities.
Nine CABIN sites have been sampled within the Neexdzii Kwa watershed, all under the “BC MOE-FSP Skeena Region” and “BC-Wet’suwet’en ESI” studies (Table 2.1; Figure 2.1). Most sites are on tributaries and were sampled once in 2004. Of particular relevance, MOR37 (“Upper Bulkley @ Morice”) is located on the Neexdzii Kwa mainstem at approximately the same location as our 2025 site BUL-01 — sampled in 2004 and again in 2018 under the Wet’suwet’en Environmental Stewardship Initiative, providing two historical benthic datasets for temporal comparison with the present study. CABIN data were obtained from the ECCC Open Government Portal.
my_caption <<- "CABIN benthic monitoring sites within the Neexdzii Kwa watershed. Sites were identified by spatial intersection of all Pacific drainage (MDA 08) CABIN study locations with the watershed boundary. MOR37 corresponds to the 2025 BUL-01 sampling location."
my_tab_caption(tip_flag = FALSE)readr::read_csv("data/processed/cabin_opendata_sites_neexdzii.csv",
show_col_types = FALSE) |>
dplyr::select(
Site,
`Site Name` = SiteName,
`Stream Order` = stream_order,
Visits = n_visits,
Years = years,
Study = studies
) |>
my_dt_table(cols_freeze_left = 2, page_length = 10)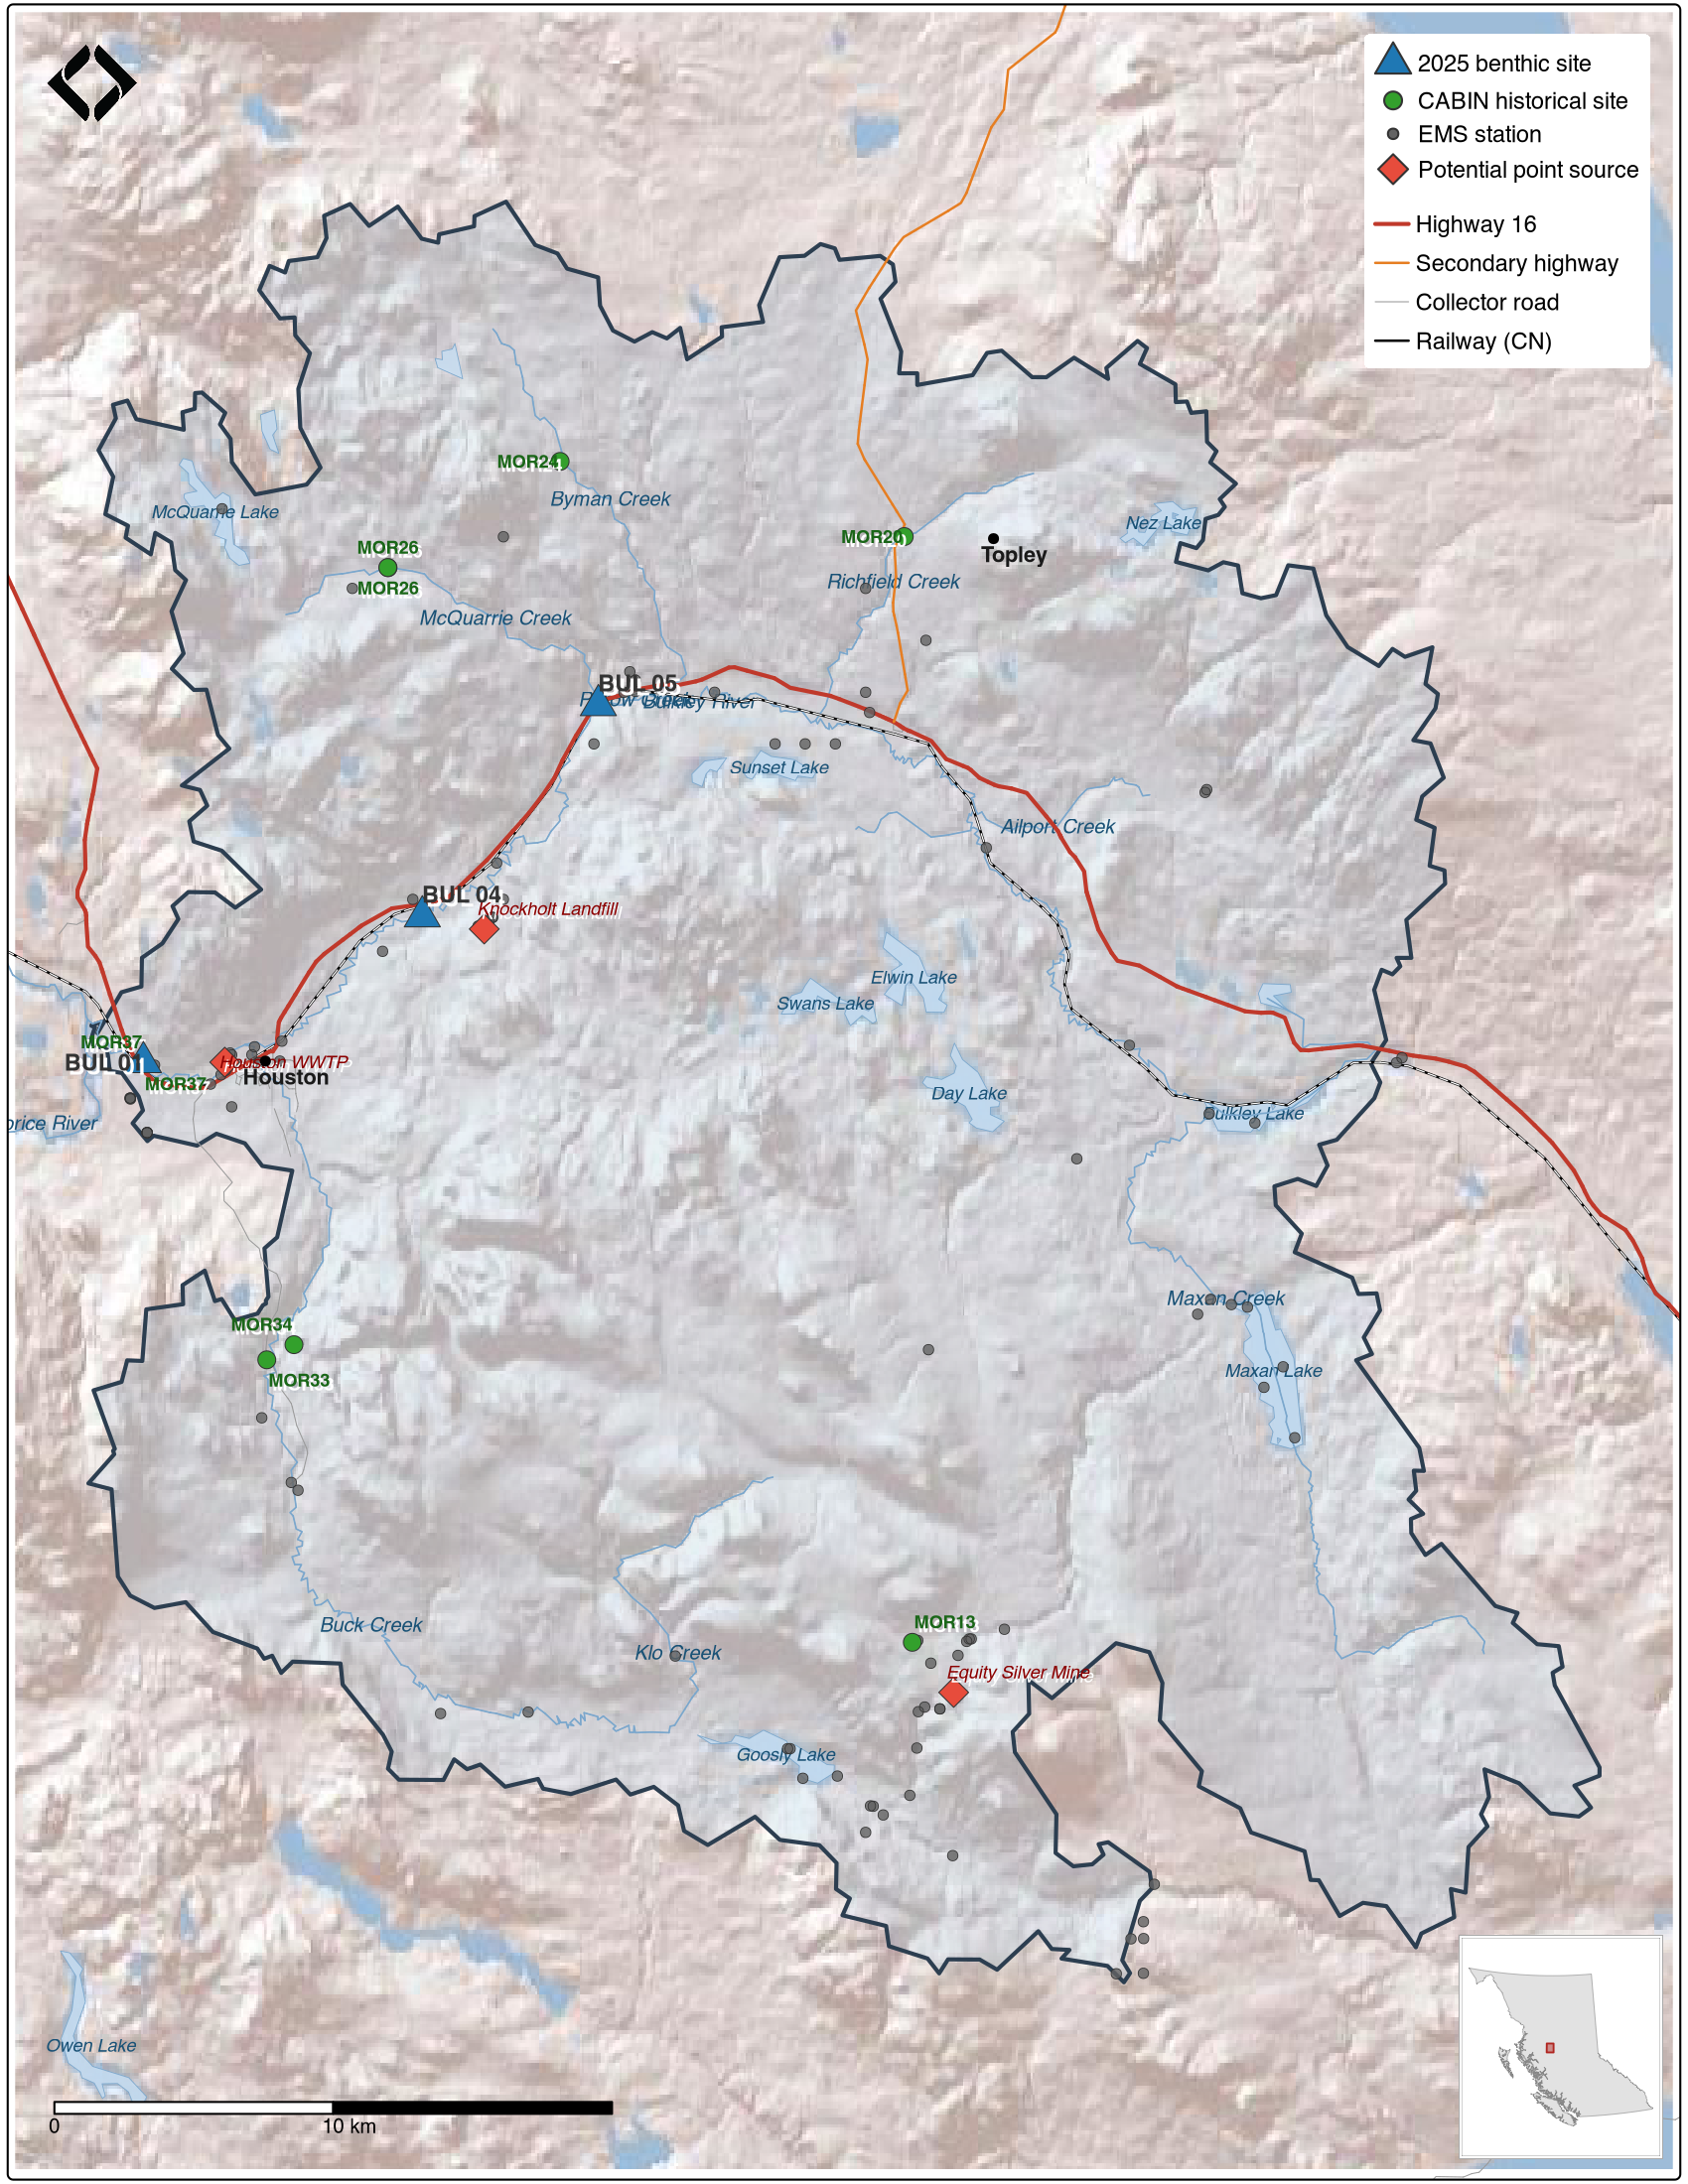
Figure 2.1: Sampling and monitoring locations within the Neexdzii Kwa watershed. Blue triangles indicate 2025 benthic sampling sites; green circles show CABIN historical sites (Table 2.1); red diamonds mark potential point sources. Grey dots are EMS water quality stations — see Appendix B for interactive detail.