A Exploratory Metrics Summary
Figures below summarize benthic invertebrate community metrics calculated by Cordillera Consulting Inc. from genus-level identifications. Box-and-whisker plots show the distribution across triplicate kick samples at each site (n = 3 per site). Individual replicates are overlaid as points. Stacked bar charts show mean proportional composition averaged across replicates. All metrics are derived from whole-sample extrapolated counts.
A.1 Community Composition
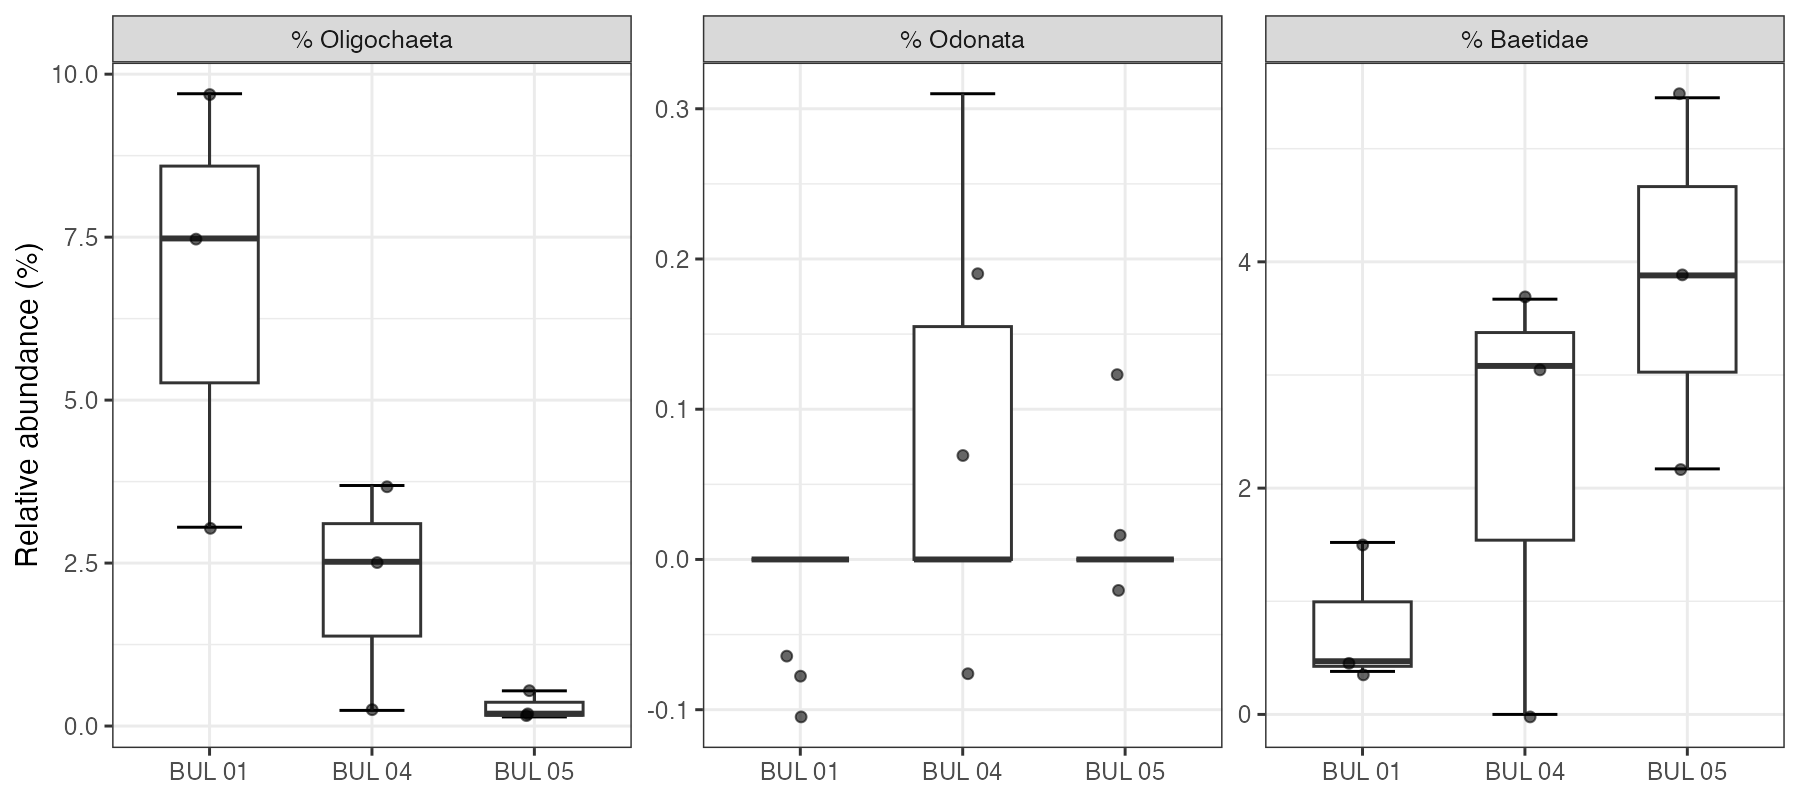
Figure A.1: Minor community groups by site. Oligochaeta, Odonata, and Baetidae shown separately to highlight potential indicator taxa.
A.2 Abundance
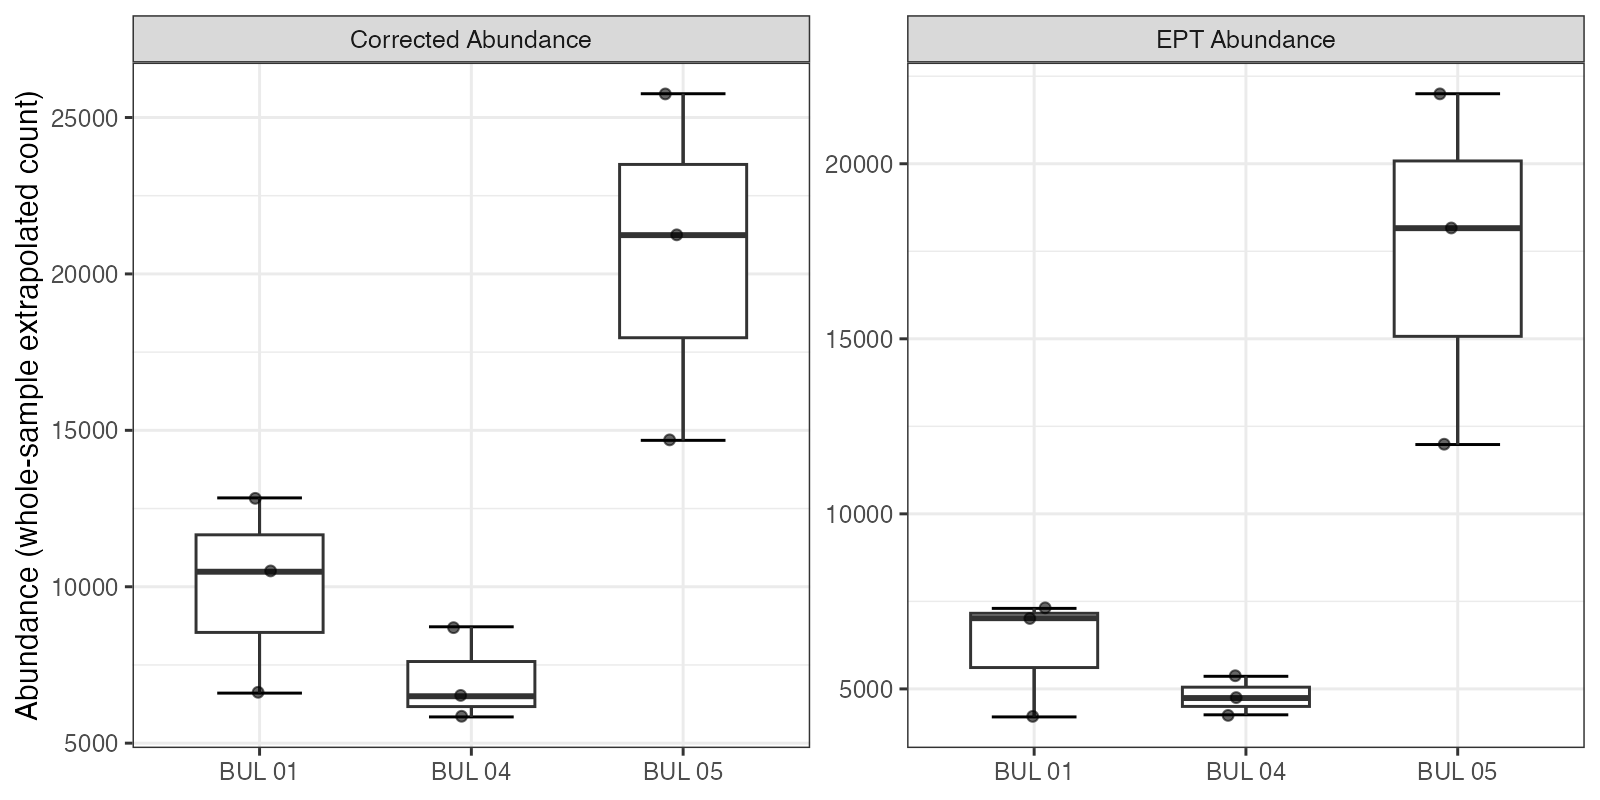
Figure A.2: Total corrected abundance and EPT abundance by site. Values are extrapolated from subsample counts to estimate whole-sample density.
A.3 Functional Feeding Groups
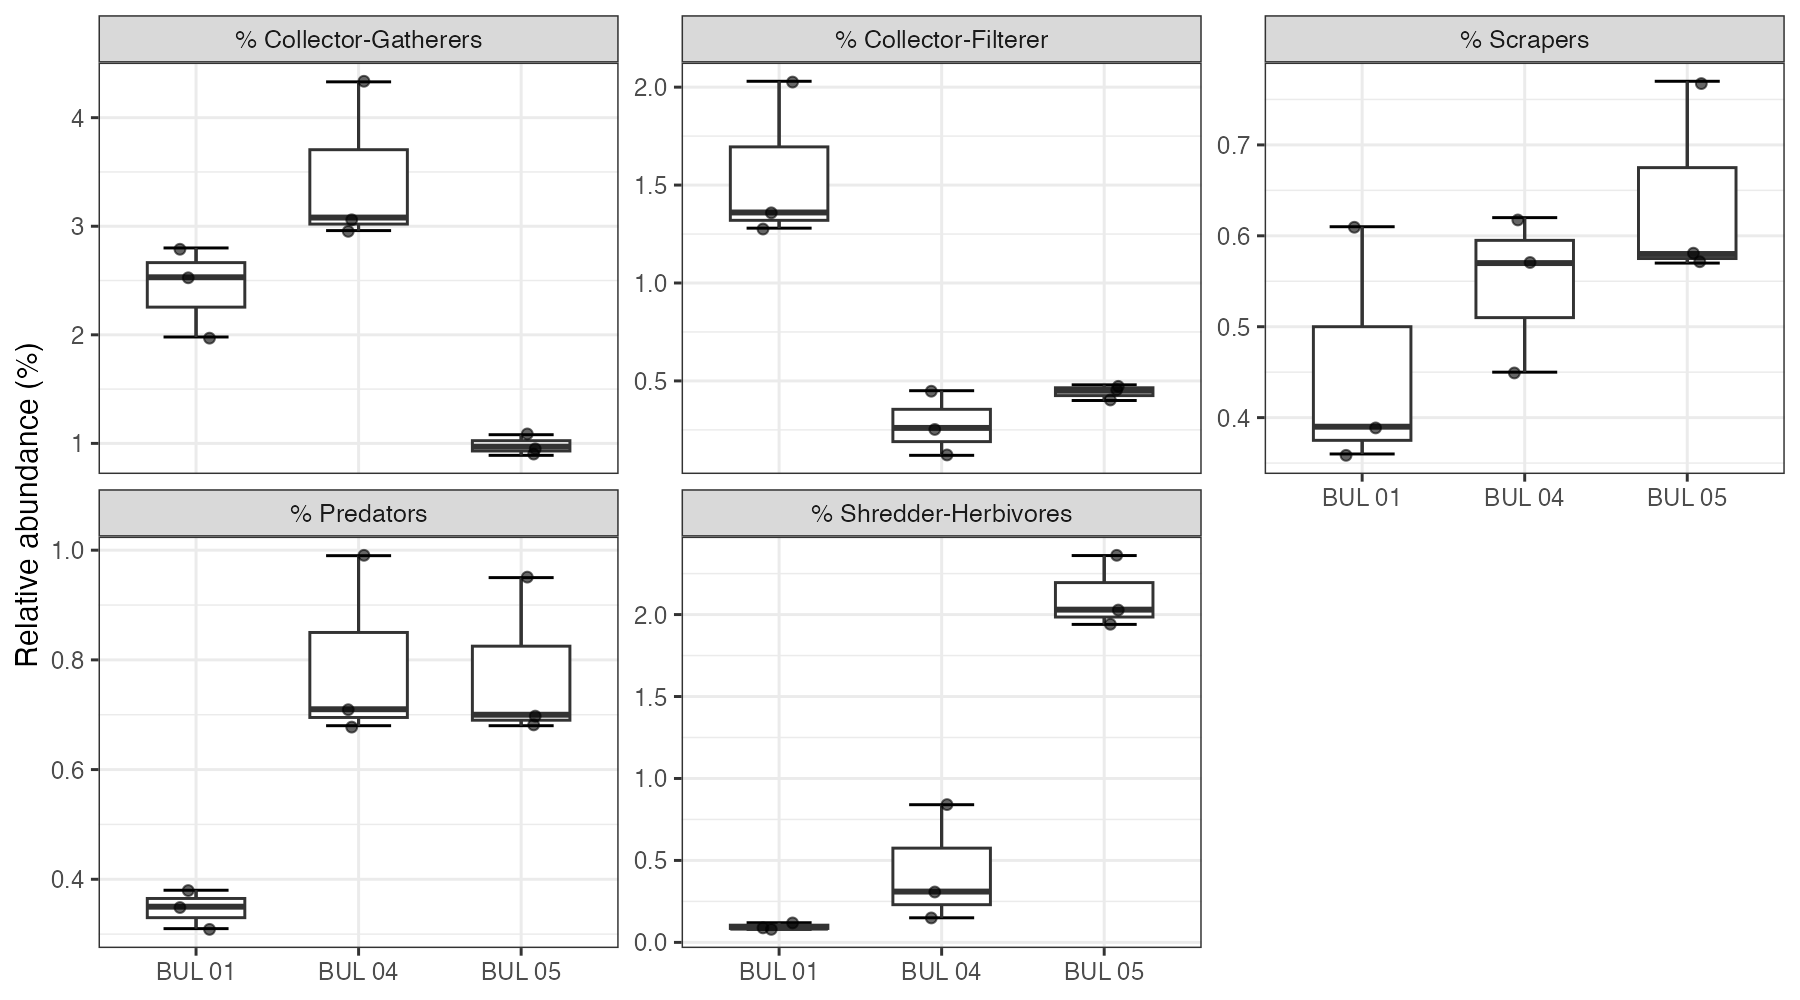
Figure A.3: Functional feeding group composition (box-and-whisker) for the five major groups by site.
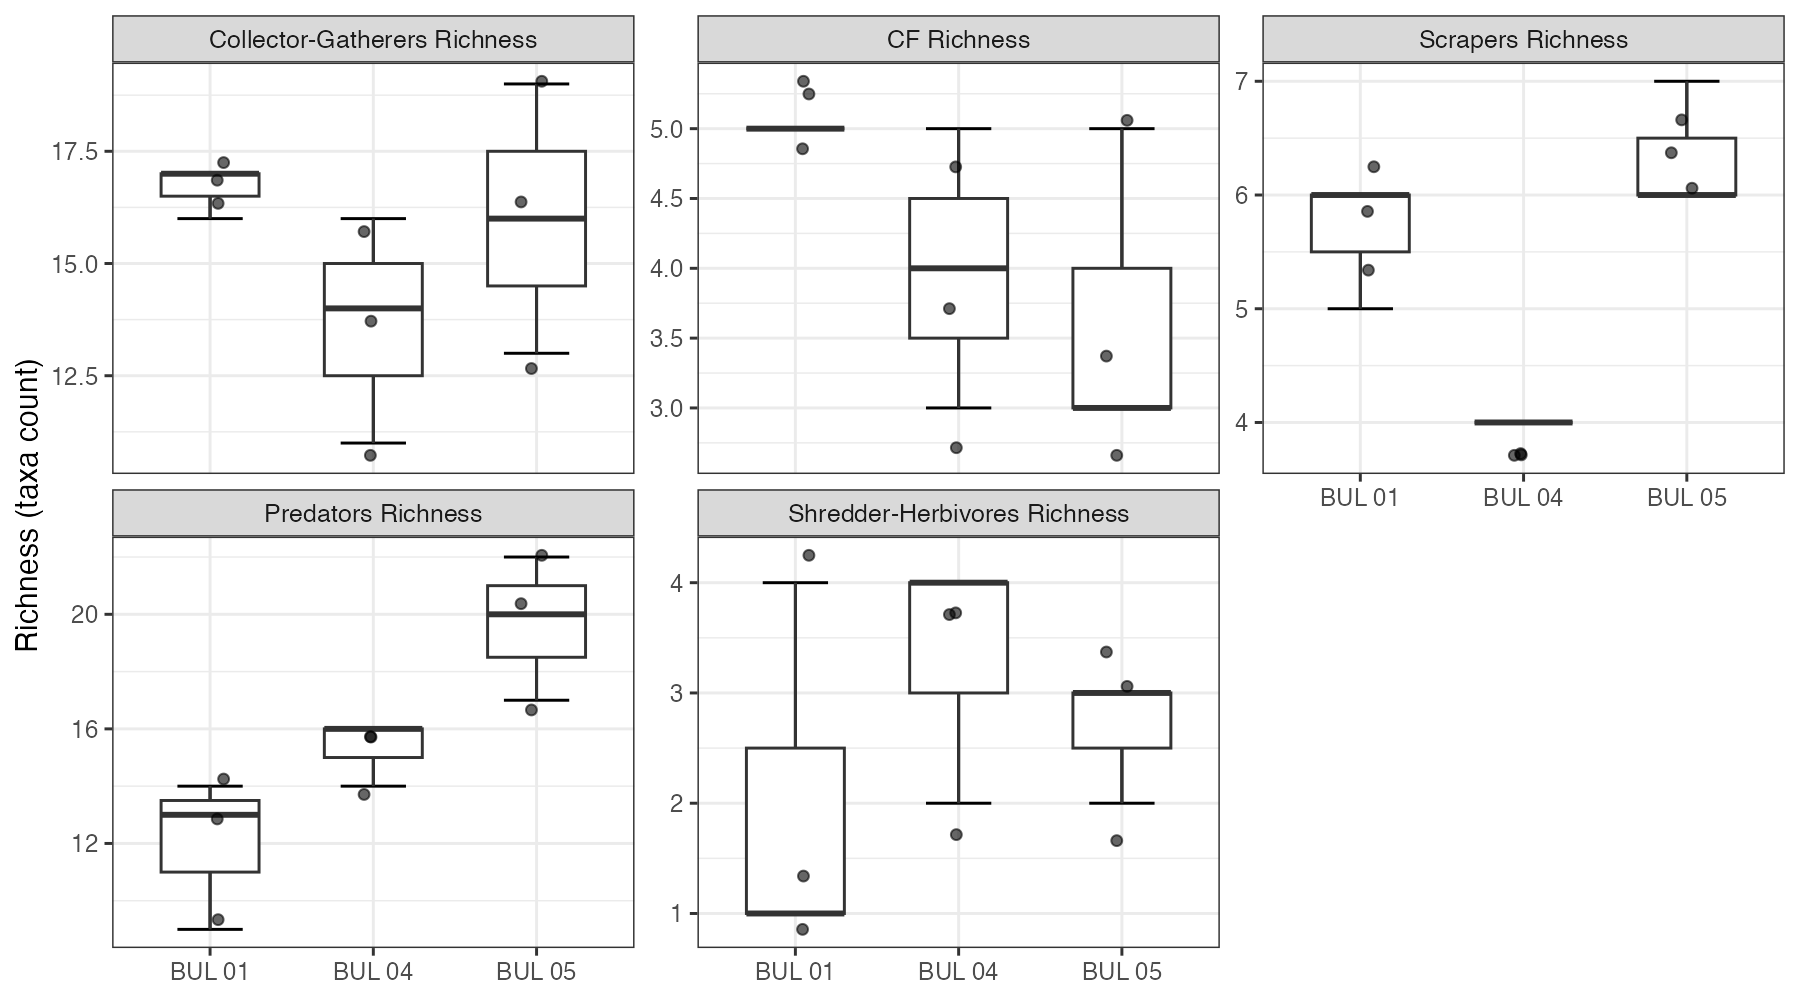
Figure A.4: Functional feeding group richness (taxa count) by site. CG = Collector-Gatherer, CF = Collector-Filterer.
A.4 Dominance
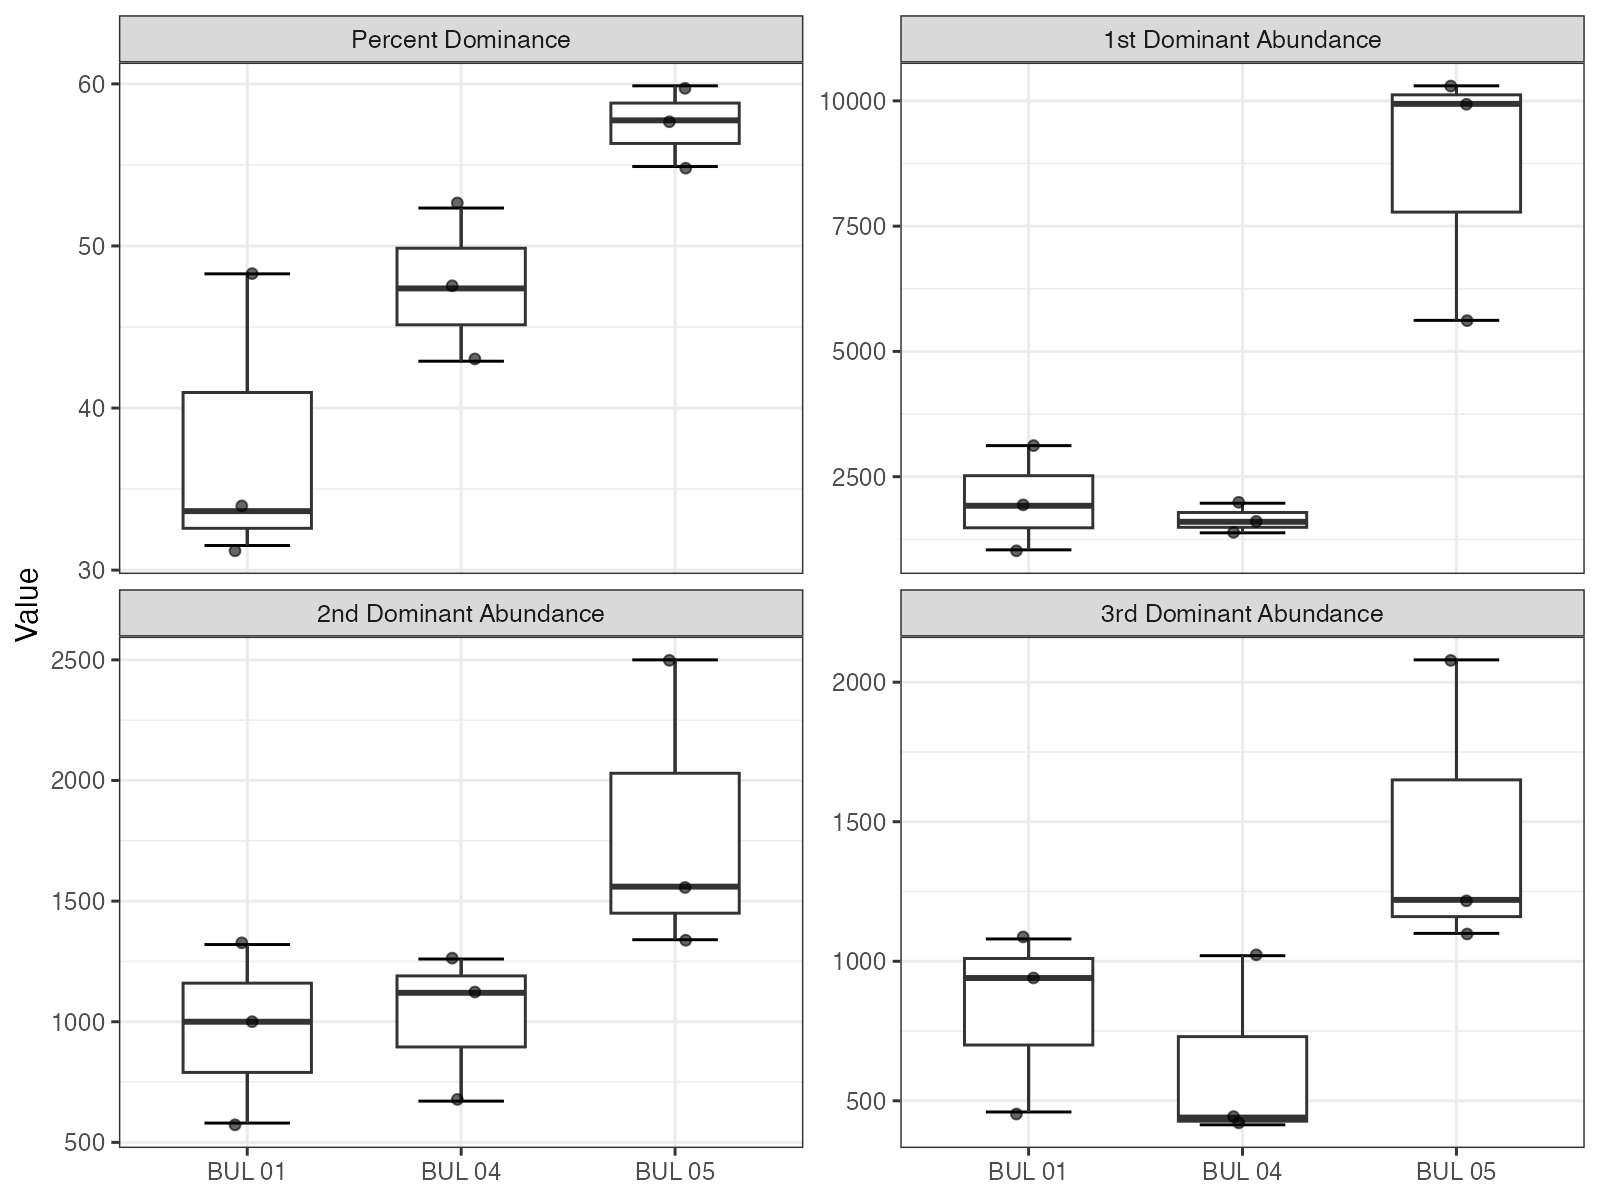
Figure A.5: Percent dominance (combined relative abundance of the three most abundant taxa) and individual dominant taxon abundances by site. Higher dominance indicates a less even community structure.
A.5 Voltinism
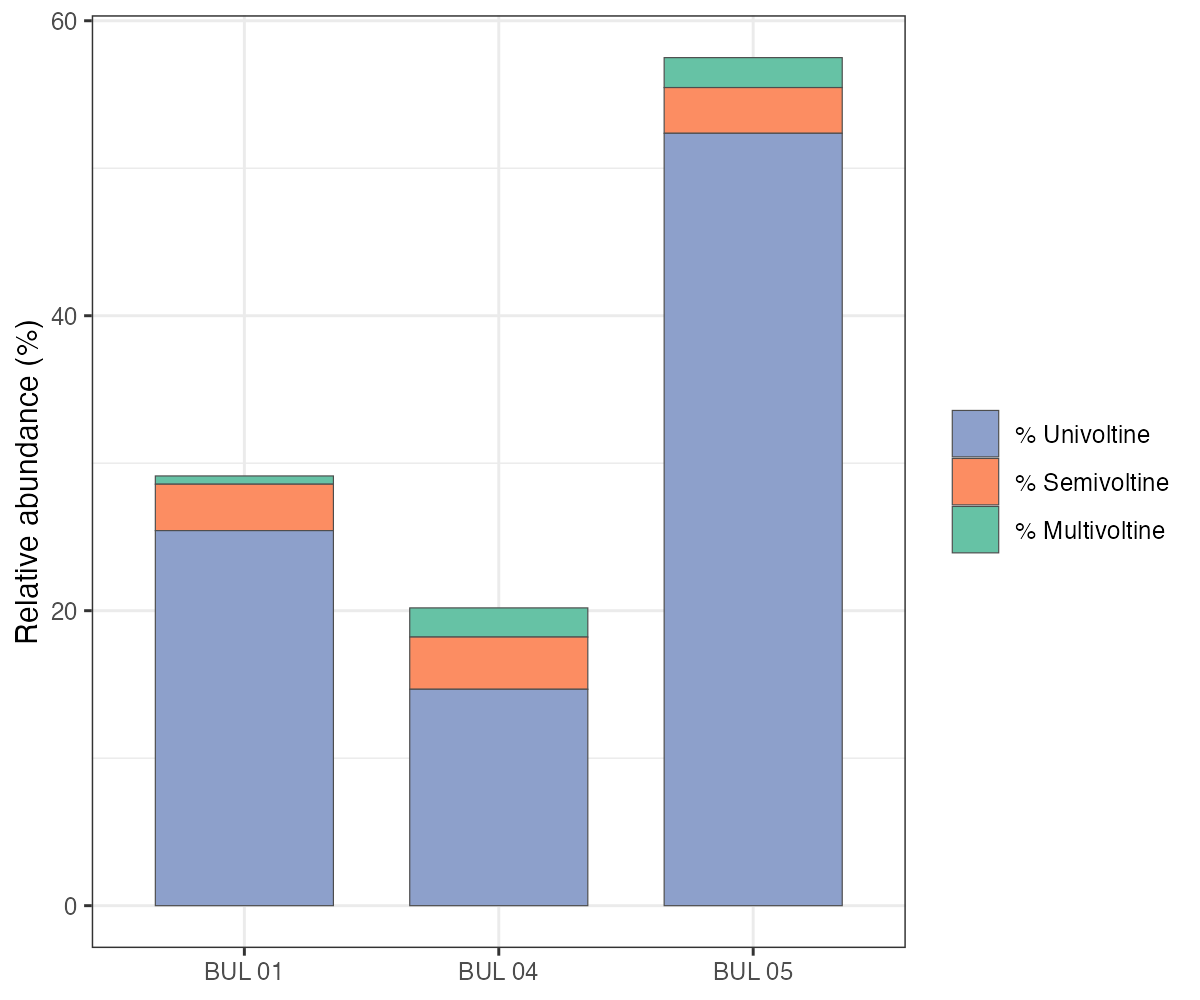
Figure A.6: Voltinism composition (stacked bar). Mean percent of community classified as univoltine (one generation per year), semivoltine (less than one), or multivoltine (more than one). Semivoltine taxa are typically associated with cooler, less disturbed streams.
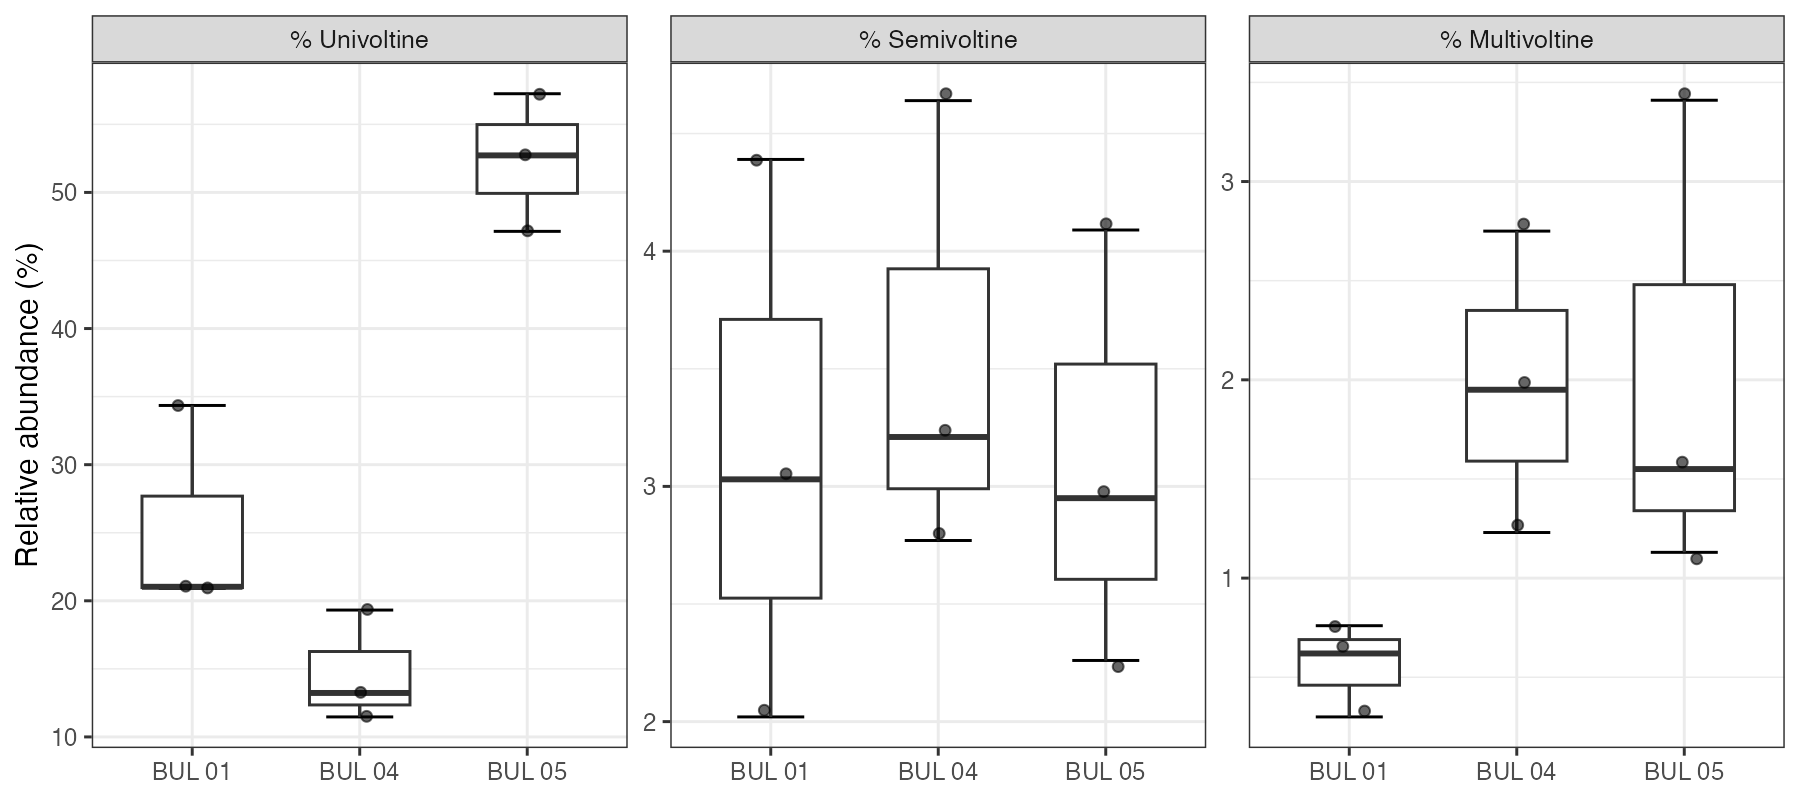
Figure A.7: Voltinism categories by site (box-and-whisker). Distribution of replicate values for each voltinism class.