2 Background
# See https://github.com/NewGraphEnvironment/mybookdown-template/issues/64
 knitr::opts_chunk$set(fig.path = "fig/background/", dev = "png")
2.1 Approach
Fish passage assessments in British Columbia follow the provincial protocol (MoE 2011), which scores barrier risk at road-stream crossings from structural parameters — culvert embedment, slope, outlet drop, and culvert diameter relative to channel width. The “Barrier” and “Potential Barrier” classifications represent passability for juvenile salmon or small resident rainbow trout under any flow conditions that may occur throughout the year (Clarkin et al. 2005; Bell 1991; Thompson 2013). The thresholds are deliberately conservative, so the classifications are risk scores rather than determinations of whether fish actually move through. Many structures classified as “Barrier” still pass some species and life stages at some flows, and natural features in adjacent reaches can be as limiting as the structure itself. Passability can be quantified in other ways — fish length, swim speed, and species physiology all affect connectivity outcomes — and finer-grained scoring methods exist for structures already classified as barriers (Bourne et al. 2011; Kemp and O’Hanley 2010; Washington Department of Fish & Wildlife 2009). Whether a remediation changes outcomes for fish therefore depends on the habitat upstream, the species and life stages in question, and the broader condition of the reach the structure connects to — not the classification alone.
The provincial inventory contains thousands of structures on fish-bearing streams. Replacement at a typical forest road culvert is in the six-figure range; structural replacements on highway and rail corridors run into seven and eight figures. Funding for restoration is finite and split across multiple programs and partners. Prioritization across the inventory therefore carries more weight than any individual assessment — the assessment establishes what could be fixed, while prioritization decides what should be.
Authority and funding for these structures are distributed across rail authorities, highway ministries, forestry licensees, and private landowners. Each operates under its own mandate, performance metrics, and budget cycle. Advancing restoration involves working inside organizations whose primary mandate is moving goods, maintaining roads, or harvesting timber — not aquatic ecological outcomes. The work proceeds through shared data, sustained relationships, and incremental progress across multiple budget years and field seasons.
Many road and rail corridors were built without consideration of fish passage or floodplain function. Damage frequently extends beyond the structure at the crossing — channelized streams, dykes that sever lateral connection, drained wetlands, cleared riparian buffers. Replacing a culvert in-kind can restore longitudinal passage while leaving the broader corridor-scale disconnection unaddressed. Understanding where infrastructure constrains watershed function helps distinguish cases where structural replacement is sufficient from cases where remediation needs to address more than the structure itself.
This report compiles the layers used for prioritization in the watershed groups where the work is active: structural assessment data, habitat modelling, climate trajectory, and floodplain extent. Each layer contributes a piece of the picture — what is present, what it could support, how it is changing, and the surrounding watershed context. The work happens over many years across many partners; this report documents one year’s contribution to that effort.
2.2 Project Location
The study area includes the FWCP Peace Region with a focus to date on traditional territories of the Tse’khene First Nations. In 2025, field assessments were completed with the Carp Lake, Crooked River, Finlay Arm, Finlay River, Firesteel River, Fox River, Ingenika River, Lower Omineca River, Mesilinka River, Nation River, Ospika River, Parsnip Arm, Parsnip River, Peace Arm, Toodoggone River, and Upper Omineca River watershed groups (Figure 2.1).
In 2019/2020, following a literature review, analysis of fish habitat modelling data, the Provincial Stream Crossing Inventory System (PSCIS) and a community scoping exercise within the McLeod Lake Indian Band habitat confirmation assessments were conducted at 17 sites throughout the Parsnip River watershed with 10 crossings rated as high priorities for rehabilitation and three crossings rated as moderate priorities for restoration. An engineering design for site 125179 on a tributary to the Missinka River was also completed through the 2019/2020 project. In 2021/2022, project activities reconvened through FWCP directed project PEA-F22-F-3577-DCA. Partners were engaged, funding was raised, planning was conducted and reporting was completed to initiate restoration activities of high priority crossings. Materials were purchased and permitting was put in place to prepare for replacement of the twin culverts on the Missinka River tributary with a clear-span bridge. In 2025/2026, this collaborative project leveraged ongoing connectivity restoration initiatives in the province and engaged multiple partners to catalyze fish passage restoration activities at high-priority sites identified in from 2019-2024.
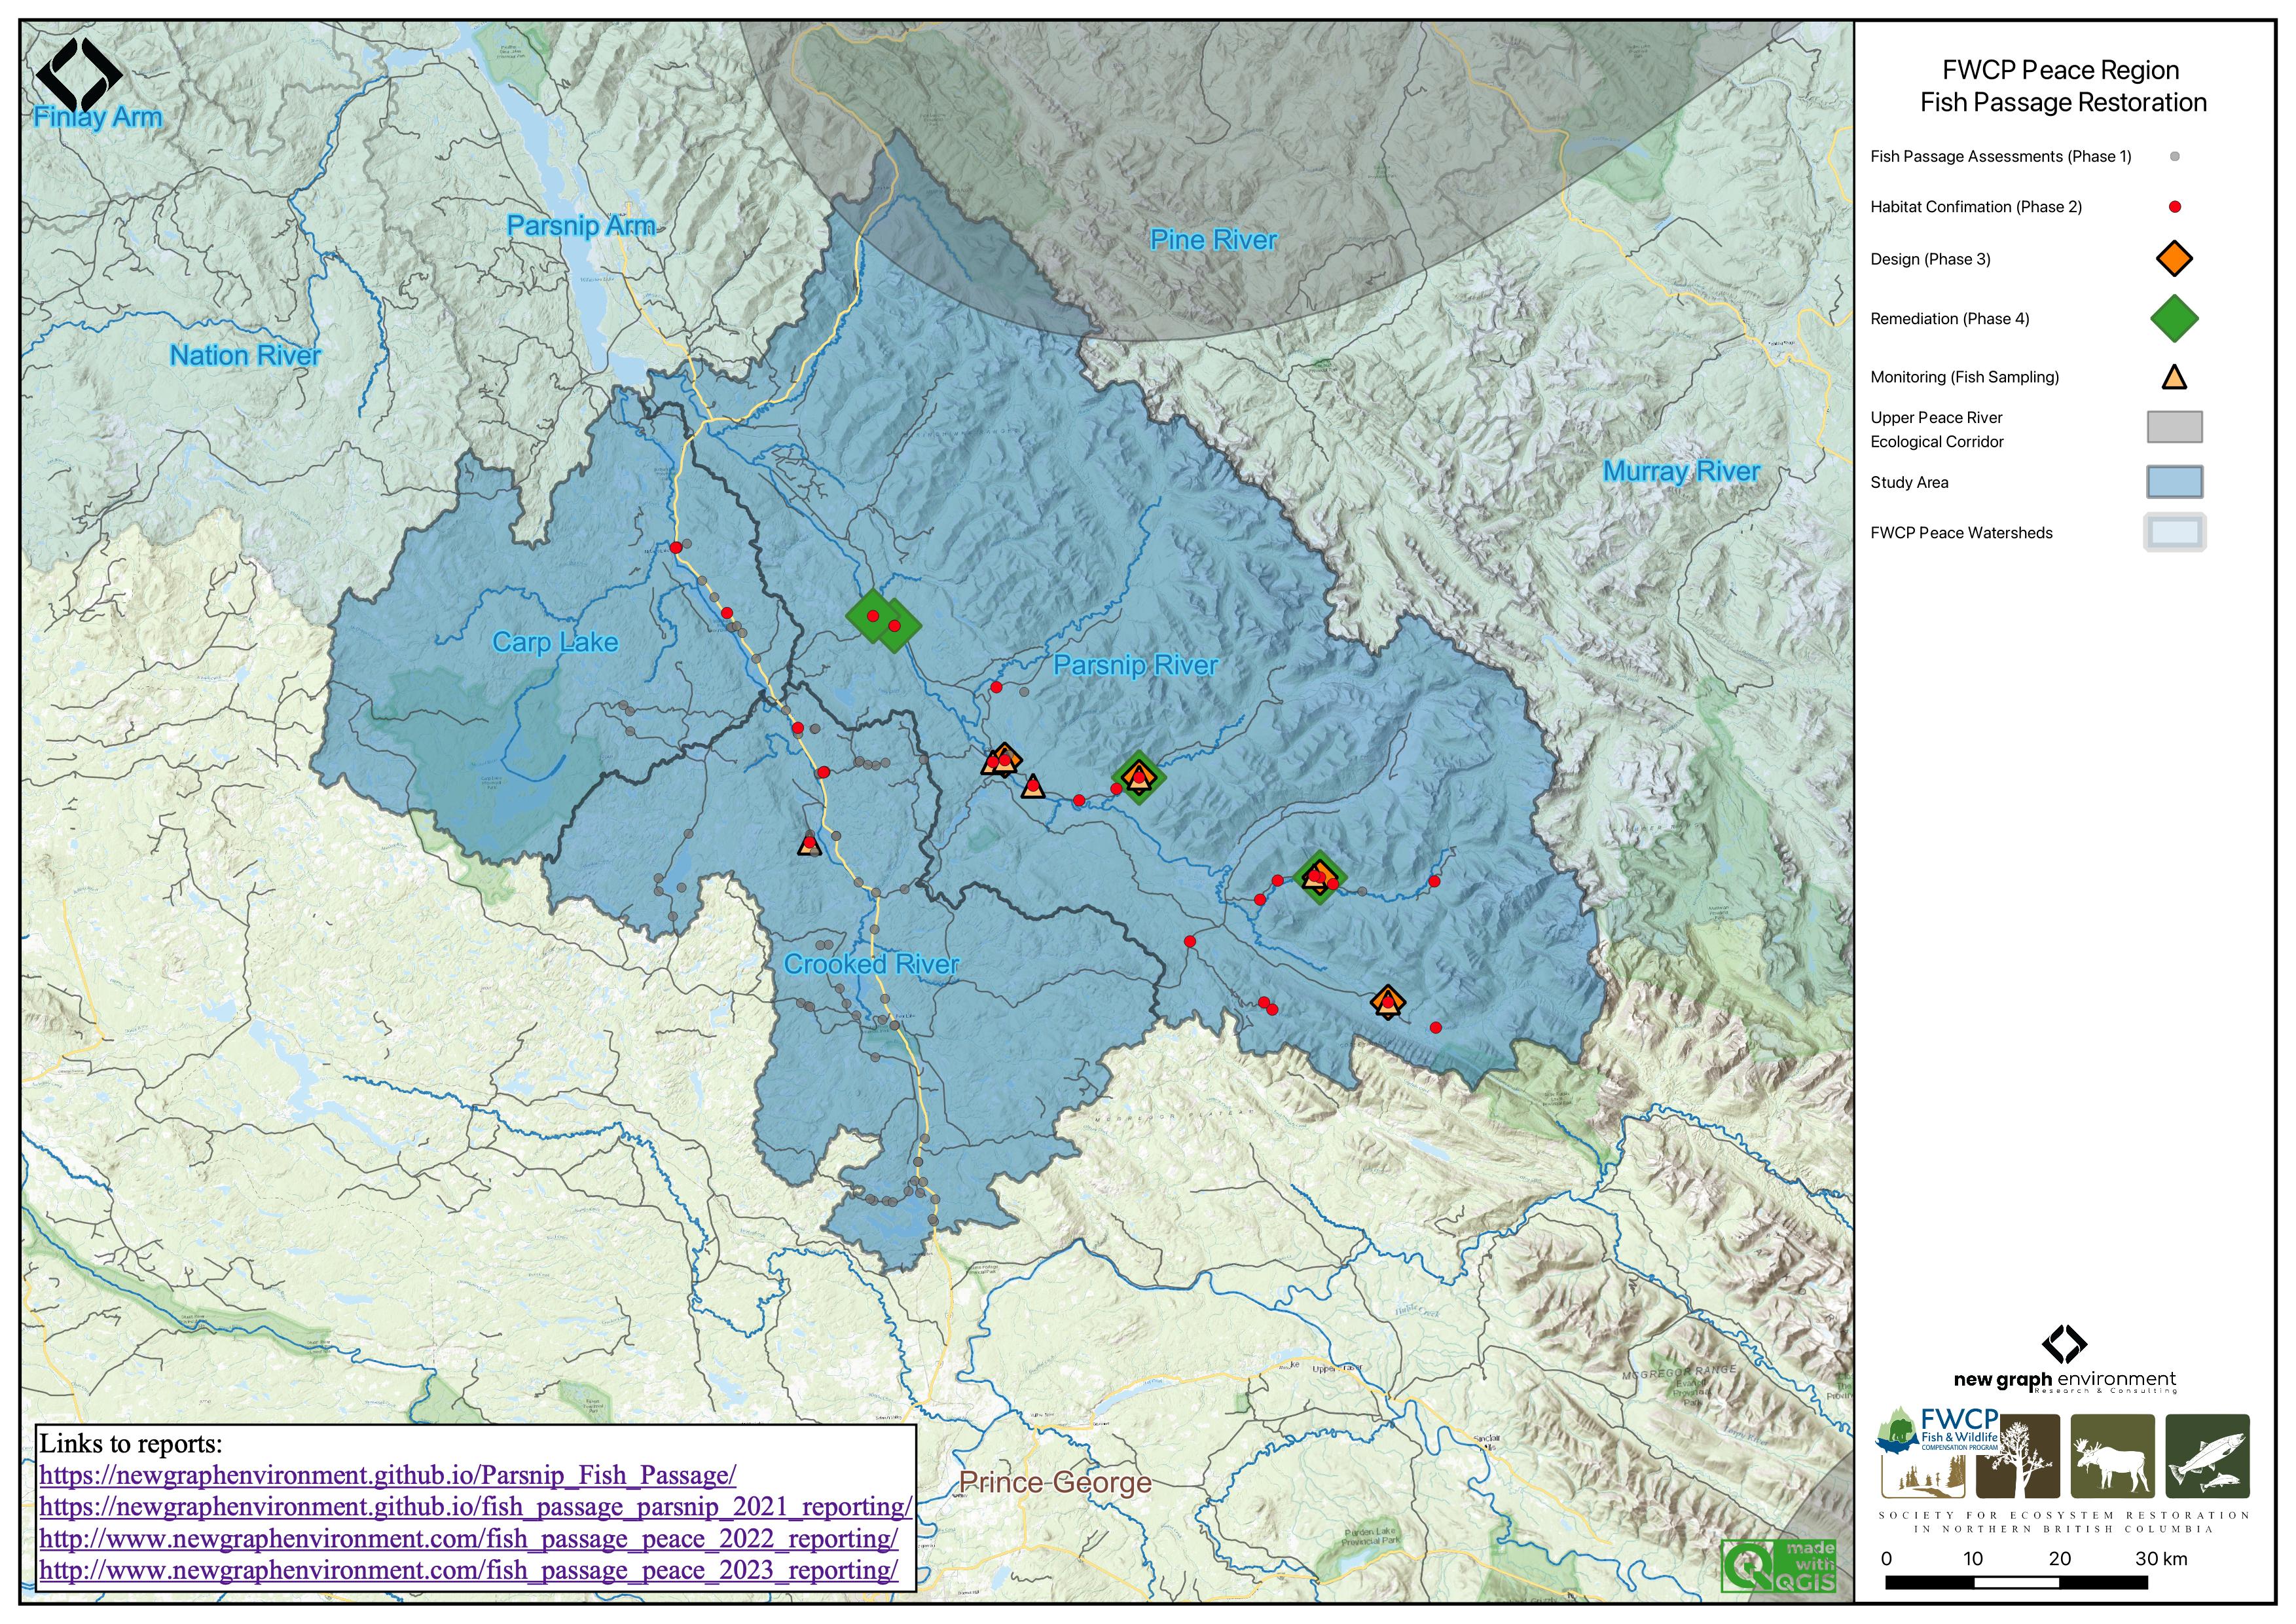
Figure 2.1: Overview map of Study Area
2.3 Tse’khene
The Parsnip River watershed is located within the south-eastern portion of the 108,000 km2 traditional territory of the Tse’khene from the McLeod Lake Indian Band. The Tse’khene “People of the Rocks” are a south westerly extension of the Athabascan speaking people of northern Canada. They were nomadic hunters whose language belongs to the Beaver-Sarcee-Tse’khene branch of Athapaskan (“History Who We Are” 2023). Extensive work is underway to preserve the language with resources such as First Voices available online and in app form for iphone and ipad devices.
The continental divide separates watersheds flowing north into the Arctic Ocean via the Mackenzie River and south and west into the Pacific Ocean via the Fraser River (Figure 2.1). The Parsnip River is a 6th order stream with a watershed that drains an area of 5597km2. The mainstem of the river flows within the Rocky Mountain Trench in a north direction into Williston Reservoir starting from the continental divide adjacent to Arctic Lakes. Major tributaries include the Misinchinka, Colbourne, Reynolds, Anzac, Table, Hominka and Missinka sub-basins which drain the western slopes of the Hart Ranges of the Rocky Mountains. The Parsnip River has a mean annual discharge of 150.5 m3/s with flow patterns typical of high elevation watersheds on the west side of the northern Rocky Mountains which receive large amounts of precipitation as snow leading to peak levels of discharge during snowmelt, typically from May to July (Figure 2.2).
Construction of the 183m high and 2134m long W.A.C. Bennett Dam was completed in 1967 at Hudson’s Hope, BC, creating the Williston Reservoir (Hirst 1991). Filling of the 375km2 reservoir was complete in 1972 and flooded a substantial portion of the Parsnip River and major tributary valleys forming what is now known as the Peace and Parsnip reaches. The replacement of riverine habitat with an inundated reservoir environment resulted in profound changes to the ecology, resource use and human settlement patterns in these systems (Hagen et al. 2015; Pearce et al. 2019; Stamford et al. 2017). Prior to the filling of the reservoir, the Pack River, into which McLeod Lake flows, was a major tributary to the Parsnip River. The Pack River currently enters the Williston Reservoir directly as the historic location of the confluence of the two rivers lies within the reservoir’s footprint.
plot1 <- fasstr::plot_longterm_monthly_stats(
  station_number = "07EE007",
  ignore_missing = TRUE
)

print(plot1$`Long-term_Monthly_Statistics`)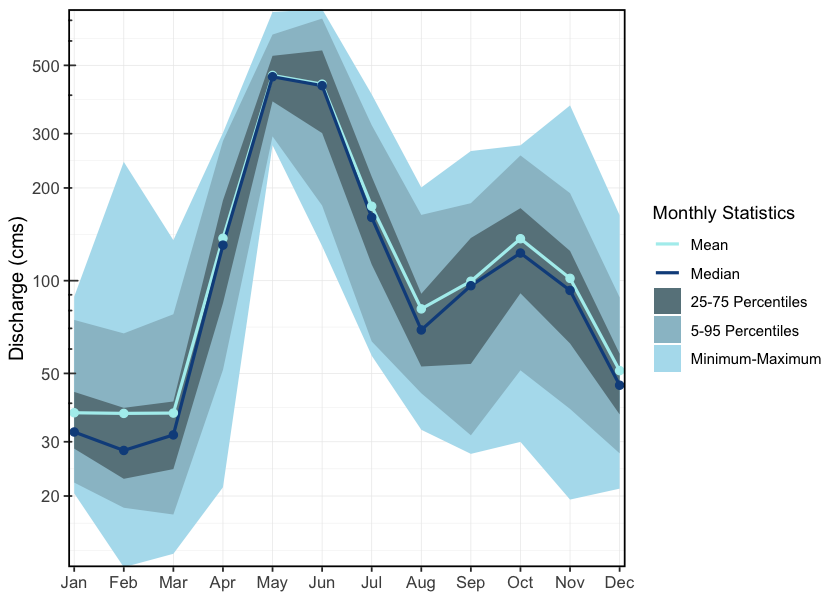
Figure 2.2: Hydrograph for Parsnip River above Misinchinka River (Station #07EE007).
2.4 Floodplains and Watershed Function
Floodplains are the low-lying ground adjacent to stream channels that water reclaims during high-flow events. They are not idle margins — they are where rivers do geomorphic work: storing and sorting sediment, exchanging nutrients between terrestrial and aquatic systems, recruiting riparian vegetation, and delivering large woody debris to the channel. For fish, floodplain habitats — side channels, sloughs, beaver complexes, oxbow ponds, and connected wetlands — provide the off-channel conditions that drive freshwater productivity. Juvenile salmonids depend on these areas for low-velocity rearing, overwinter refuge when mainstem conditions become harsh, and high-flow shelter during freshet. In many systems, floodplain habitats are where freshwater survival is won or lost.
Floodplains are often the part of the watershed most compromised by the infrastructure legacy described above. Dykes sever lateral connection; channelization confines the active footprint; drainage eliminates wetland complexes. Mapping floodplain extent at watershed scale therefore complements the linear barrier inventory — prioritization can consider not just whether a structure passes fish but the condition and extent of the off-channel habitat in the reach the structure connects to.
2.5 Fisheries
Fish species recorded in the BC Fisheries Information Summary System (FISS) for the watershed groups in this study area are summarised in Appendix - Fish Species by Watershed Group (MoE 2024a). In addition to flooding related to the formation of the Williston Reservoir, transmission lines, gas pipelines, rail, road networks, forestry, elevated water temperatures, interrupted connectivity, invasion from non-native species and insect infestations affecting forested areas pose threats to fisheries values in the Parsnip River watershed (Hagen et al. 2015; Stamford et al. 2017; Hagen and Weber 2019; COSEWIC 2012). A brief summary of trends and knowledge status related to Arctic grayling, bull trout, kokanee, mountain whitefish and rainbow trout in Williston Watershed streams is provided in Fish and Wildlife Compensation Program (2020) with a more detailed review of the state of knowledge for Parsnip River watershed populations of Arctic grayling and bull trout provided below.
Bull Trout - sa’ba
Tse’khene Elders from the McLeod Lake Indian Band report that sa’ba (bull trout) size and abundance has decreased in all rivers and tributaries from the reservoir with more injured and diseased fish captured in recent history than was common in the past (Pearce et al. 2019) .
Bull trout populations of the Williston Reservoir watershed are included within the Western Arctic population ‘Designatable Unit 10’, which, in 2012, received a ranking of ‘Special Concern’ by the Committee on the Status of Endangered Wildlife in Canada (COSEWIC 2012). They were added to Schedule 1 under the Species of Risk Act in 2019 (Species Registry Canada 2020) and are also considered of special concern (blue-listed) provincially (BC Species & Ecosystem Explorer 2020). Some or all of the long-term foot survey index sections of four Williston Reservoir spawning tributaries (Davis Creek, Misinchinka River, Point Creek, and Scott Creek), have been surveyed within 16 of the 19 years between 2001 and 2019 (16 of 19 in Davis River, 10 years over a 13-year period in the Misinchinka River, 11 years over a 14-year period for Point Creek, and 9 years over an 11-year period for Scott Creek (Hagen et al. 2020).
A study of bull trout critical habitats in the Parsnip River was conducted in 2014 with the Misinchinka and Anzac systems identified as the most important systems for adfluvial (large bodied) bull trout spawners. The Table River was also highlighted as an important spawning destination. Other watersheds identified as containing runs of large bodied bull trout spawners included the Colbourne, Reynolds, Hominka and Missinka River with potentially less than 50 spawners utilizing each sub-basin (Hagen et al. 2015). Hagen and Weber (2019) have synthesized a large body of information regarding limiting factors, enhancement potential, critical habitats and conservation status for bull trout of the Williston Reservoir and the reader is encouraged to review this work for context. They have recommended experimental enhancements within a monitoring framework for Williston Reservoir bull trout (some spawning and rearing in Parsnip River mainstem and tributaries) which include stream fertilization, side channel development, riparian restoration and fish access improvement.
In 2018, sub-basins of the Anzac River watershed, Homininka River, Missinka River and Table River watersheds were designated as fisheries sensitive watersheds under the authority of the Forest and Range Practices Act due to significant downstream fisheries values and significant watershed sensitivity (Beaudry 2013a, 2014, 2013b; P. Beaudry 2014). Special management is required in these watersheds to protect habitat for fish species including bull trout and Arctic grayling including measures (among others) to limit equivalent clearcut area, reduce impacts to natural stream channel morphology, retain old growth attributes and maintain fish habitat/movement (Forest and Range Practices Act 2018).
Arctic Grayling - dusk’ihje
Tse’khene Elders from the McLeod Lake Indian Band report that dusk’ihje (Arctic grayling) numbers have declined dramatically since the flooding of the reservoir and that few dusk’ihje have been caught in the territory in the past 30 years (Pearce et al. 2019).
Since impoundment of the Williston Reservoir, it appears that physical habitat and ecological changes have been the most significant factors limiting Arctic grayling productivity. Although these changes are not well understood they have likely resulted in the inundation of key low gradient juvenile rearing and overwintering habitats, isolation of previously connected populations and increases in abundance of predators such as bull trout (Shrimpton et al. 2012; Hagen et al. 2018). Rapid increases in industrial activity and angler access in the Parsnip River watershed pose significant risks to Arctic Grayling productivity with these threats primarily linked to forestry and pipeline initiatives (Hagen and Stamford 2021).
A detailed review of Arctic grayling life history is available in Stamford et al. (2017). Migration of mature adult Arctic grayling occurs in the spring, typically coinciding with water temperatures of 4\(^\circ\)C. In the Parsnip watershed, spawning appears to occur between late May and late June, primarily within the lower reaches of the Anzac and Table rivers and the Parsnip River mainstem. Spawning habitat is generally associated with side-channel and multi-channel areas containing small gravels. The current distribution of Williston Arctic grayling is concentrated in fourth-order and larger streams (Williamson and Zimmerman 2005; Stamford et al. 2017). According to Stewart et al. (2007), Arctic grayling spawn in both large and small tributaries to rivers and lakes, intermittent streams, mainstem rivers, and lakes—most commonly at tributary mouths. Although earlier studies suggest that 0+ grayling overwinter in the lower reaches of larger tributaries (e.g., Table and Anzac rivers) and the Parsnip River, and that few age-1+ grayling have been sampled in tributaries, habitat use in small tributaries and the extent to which they are connected with mainstem habitats across all core areas remains poorly understood. Between 1995 and 2019, population monitoring of Arctic grayling was conducted in the Table River in 9 out of 25 years, and in the Anzac River for 8 years, using snorkel surveys. Results from 2018 and 2019 support efforts to assess the conservation status of the species in the Parsnip Core Area (Hagen et al. 2018). Preliminary telemetry data from 2019 indicate that both Arctic grayling and bull trout rely on the Parsnip River mainstem for overwinter residency. Arctic grayling typically begin moving into tributaries in April and are widespread across the watershed by June, with larger adults observed in headwater habitats by August.
A five-year study on Arctic grayling abundance and trends in the Parsnip River watershed is presented in Hagen and Stamford (2023), which reports that the most productive summer rearing habitats for Arctic grayling are within the Anzac and Table rivers. Although estimated abundance is lower than in the Anzac and Table, productive summer rearing habitats for adult Arctic grayling in the upper Parsnip River watershed are distributed between 36–25km of the Missinka River and 48–32km of the Hominka River. In the Anzac River, Hagen and Stamford (2021) report that a 30km stretch from 47km to 16km supports high Arctic grayling abundance and is assumed to provide productive rearing habitat for adults. A chute obstruction located at 47km likely limits further upstream movement. Although the spatial distribution of high Arctic grayling abundance in the Table River has not been delineated through reconnaissance surveys, it has been observed to span at least a 20km zone from the waterfall migration barrier at 37km to 18km.
Spatial ecology studies in the Parsnip River between 2018 and 2021 has been reported on by Martins et al. (2022) with results related to:
- temperature modeling and spatio-temporal patterns in thermal habitat,
- telemetry data modeling and arctic grayling spatial ecology, and
- trophic relationships between Arctic grayling and bull trout
Fish presence by Habitat Type
A review of available fisheries data for the Parsnip River watershed stratified by different habitat characteristics (stream gradient, channel width, and watershed size) can provide insight into which habitats may provide the highest intrinsic value for fish species based on the number of fish captured in those habitats in past assessment work (Tables 2.1 - 2.3 and Figures 2.3 - 2.5). It should be noted however that it should not be assumed that all habitat types have been sampled in a non-biased fashion or that particular sites selected do not have a disproportionate influence on the overall dataset composition (ie. fish salvage sites are often located adjacent to construction sites which are more commonly located near lower gradient stream reaches).
# fiss_sum <- readr::read_csv(file = paste0(getwd(), '/data/extracted_inputs/fiss_sum.csv'))
fiss_sum_grad <- readr::read_csv(file = paste0(getwd(), '/data/inputs_extracted/fiss_sum_grad.csv'))
fiss_sum_width <- readr::read_csv(file = paste0(getwd(), '/data/inputs_extracted/fiss_sum_width.csv'))
fiss_sum_wshed <- readr::read_csv(file = paste0(getwd(), '/data/inputs_extracted/fiss_sum_wshed.csv'))


# A summary of historical westslope cutthrout trout observations in the Elk River watershed group by average gradient category of associated stream segment is provided in Figure \@ref(fig:fish-wct-bar). Of `r wct_elkr_grad %>% dplyr::filter(gradient_id == 3) %>% pull(total)` observations, `r wct_elkr_grad %>% dplyr::filter(gradient_id == 3) %>% pull(Percent) + wct_elkr_grad %>% dplyr::filter(gradient_id == 5) %>% pull(Percent) + wct_elkr_grad %>% dplyr::filter(gradient_id == 8) %>% pull(Percent)`% were within stream segments with average gradients ranging from 0 - 8%.  A total of `r wct_elkr_grad %>% dplyr::filter(gradient_id == 3) %>% pull(Percent)`% of historic observations were within stream segments with gradients between 0 - 3%, `r wct_elkr_grad %>% dplyr::filter(gradient_id == 5) %>% pull(Percent)`% were within stream segments with gradients ranging from 3 - 5% and `r wct_elkr_grad %>% dplyr::filter(gradient_id == 5) %>% pull(Percent)`% were within stream segments with gradients between 5 - 8% [@moe2024KnownBC; @norris2020bcfishobs].
my_caption <- paste0('Summary of historic fish observations vs. stream gradient category for the ', knitr::combine_words(wsg_names), ' watershed groups.')
fiss_sum_grad |>
dplyr::select(-gradient_id) |>
fpr::fpr_kable(caption_text = my_caption,
scroll = gitbook_on)| species_code | Gradient | Count | total_spp | Percent |
|---|---|---|---|---|
| BT | 0 - 3 % | 411 | 614 | 67 |
| BT | 03 - 5 % | 86 | 614 | 14 |
| BT | 05 - 8 % | 58 | 614 | 9 |
| BT | 08 - 15 % | 50 | 614 | 8 |
| BT | 15 - 22 % | 9 | 614 | 1 |
| GR | 0 - 3 % | 249 | 251 | 99 |
| GR | 03 - 5 % | 2 | 251 | 1 |
| KO | 0 - 3 % | 145 | 150 | 97 |
| KO | 03 - 5 % | 2 | 150 | 1 |
| KO | 05 - 8 % | 2 | 150 | 1 |
| KO | 22+ % | 1 | 150 | 1 |
| RB | 0 - 3 % | 2035 | 2619 | 78 |
| RB | 03 - 5 % | 275 | 2619 | 11 |
| RB | 05 - 8 % | 186 | 2619 | 7 |
| RB | 08 - 15 % | 103 | 2619 | 4 |
| RB | 15 - 22 % | 14 | 2619 | 1 |
| RB | 22+ % | 6 | 2619 | 0 |
fiss_sum_grad |>
  dplyr::filter(gradient_id != 99) |>
  ggplot2::ggplot(ggplot2::aes(x = Gradient, y = Percent)) +
  ggplot2::geom_bar(stat = "identity") +
  ggplot2::facet_wrap(~species_code, ncol = 2) +
  ggplot2::theme_bw(base_size = 11) +
  ggplot2::labs(x = "Average Stream Gradient", y = "Occurrences (%)")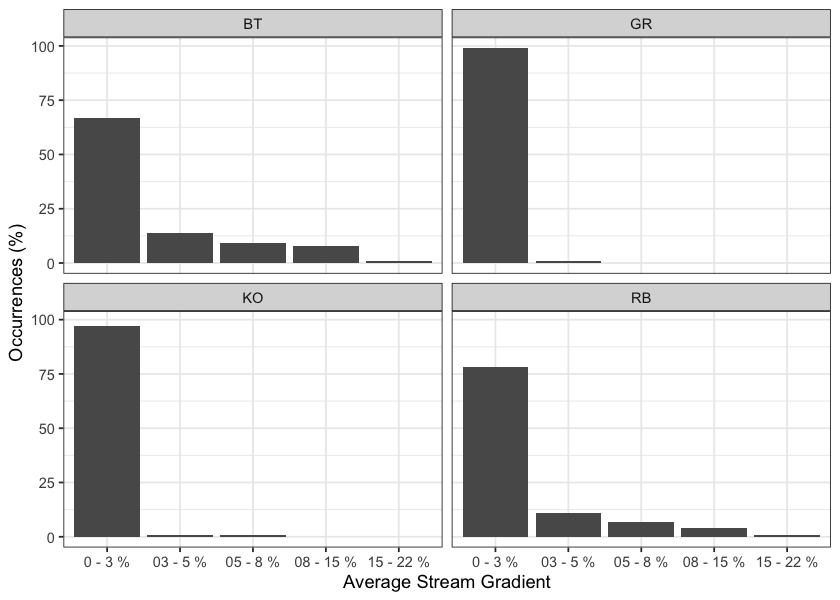
Figure 2.3: Summary of historic fish observations vs. stream gradient category for the Carp Lake, Crooked River, Finlay Arm, Finlay River, Firesteel River, Fox River, Ingenika River, Lower Omineca River, Mesilinka River, Nation River, Ospika River, Parsnip Arm, Parsnip River, Peace Arm, Toodoggone River, and Upper Omineca River watershed groups.
my_caption <- paste0('Summary of historic fish observations vs. channel width category for the ', knitr::combine_words(wsg_names), ' watershed groups.')
fiss_sum_width |>
  dplyr::select(-width_id) |>
  fpr::fpr_kable(caption_text = my_caption,
scroll = gitbook_on)| species_code | Width | Count | total_spp | Percent |
|---|---|---|---|---|
| BT | 0 - 2m | 30 | 614 | 5 |
| BT | 02 - 04m | 96 | 614 | 16 |
| BT | 04 - 06m | 81 | 614 | 13 |
| BT | 06 - 10m | 82 | 614 | 13 |
| BT | 10 - 15m | 59 | 614 | 10 |
| BT | 15m+ | 248 | 614 | 40 |
| BT | – | 18 | 614 | 3 |
| GR | 02 - 04m | 6 | 251 | 2 |
| GR | 06 - 10m | 6 | 251 | 2 |
| GR | 10 - 15m | 6 | 251 | 2 |
| GR | 15m+ | 231 | 251 | 92 |
| GR | – | 2 | 251 | 1 |
| KO | 0 - 2m | 4 | 150 | 3 |
| KO | 02 - 04m | 22 | 150 | 15 |
| KO | 04 - 06m | 3 | 150 | 2 |
| KO | 06 - 10m | 11 | 150 | 7 |
| KO | 10 - 15m | 5 | 150 | 3 |
| KO | 15m+ | 31 | 150 | 21 |
| KO | – | 74 | 150 | 49 |
| RB | 0 - 2m | 656 | 2619 | 25 |
| RB | 02 - 04m | 520 | 2619 | 20 |
| RB | 04 - 06m | 257 | 2619 | 10 |
| RB | 06 - 10m | 222 | 2619 | 8 |
| RB | 10 - 15m | 122 | 2619 | 5 |
| RB | 15m+ | 454 | 2619 | 17 |
| RB | – | 388 | 2619 | 15 |
fiss_sum_width |>
  dplyr::filter(!is.na(width_id)) |>
  ggplot2::ggplot(ggplot2::aes(x = Width, y = Percent)) +
  ggplot2::geom_bar(stat = "identity") +
  ggplot2::facet_wrap(~species_code, ncol = 2) +
  ggplot2::theme_bw(base_size = 11) +
  ggplot2::labs(x = "Channel Width", y = "Occurrences (%)")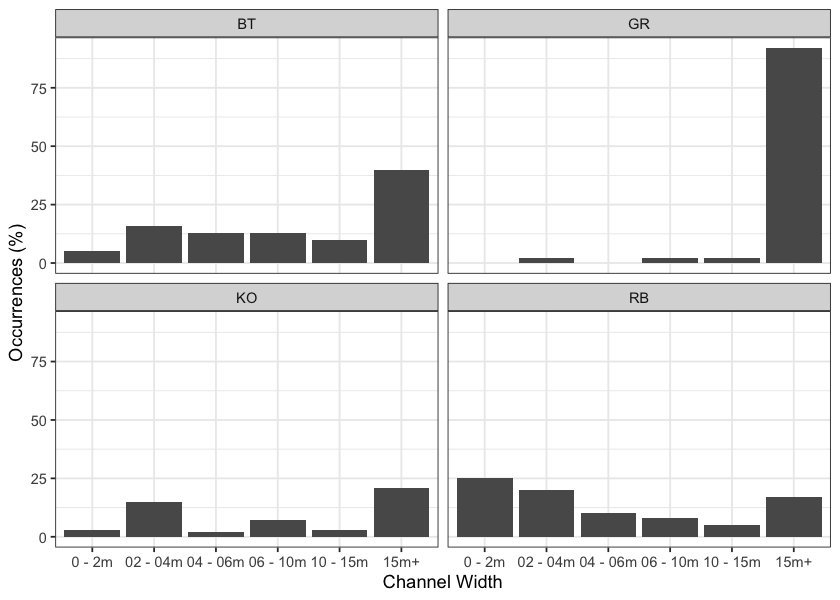
Figure 2.4: Summary of historic fish observations vs. channel width category for the Carp Lake, Crooked River, Finlay Arm, Finlay River, Firesteel River, Fox River, Ingenika River, Lower Omineca River, Mesilinka River, Nation River, Ospika River, Parsnip Arm, Parsnip River, Peace Arm, Toodoggone River, and Upper Omineca River watershed groups.
my_caption <- paste0('Summary of historic fish observations vs. watershed size category for the ', knitr::combine_words(wsg_names), ' watershed groups.')
fiss_sum_wshed |>
  fpr::fpr_kable(caption_text = my_caption,
scroll = gitbook_on)| species_code | Watershed | count_wshd | total_spp | Percent |
|---|---|---|---|---|
| BT | 0 - 25km2 | 252 | 614 | 41 |
| BT | 25 - 50km2 | 93 | 614 | 15 |
| BT | 50 - 75km2 | 40 | 614 | 7 |
| BT | 75 - 100km2 | 11 | 614 | 2 |
| BT | 100km2+ | 218 | 614 | 36 |
| GR | 0 - 25km2 | 8 | 251 | 3 |
| GR | 50 - 75km2 | 2 | 251 | 1 |
| GR | 75 - 100km2 | 4 | 251 | 2 |
| GR | 100km2+ | 237 | 251 | 94 |
| KO | 0 - 25km2 | 105 | 150 | 70 |
| KO | 25 - 50km2 | 6 | 150 | 4 |
| KO | 50 - 75km2 | 5 | 150 | 3 |
| KO | 75 - 100km2 | 3 | 150 | 2 |
| KO | 100km2+ | 31 | 150 | 21 |
| RB | 0 - 25km2 | 1802 | 2619 | 69 |
| RB | 25 - 50km2 | 171 | 2619 | 7 |
| RB | 50 - 75km2 | 97 | 2619 | 4 |
| RB | 75 - 100km2 | 48 | 2619 | 2 |
| RB | 100km2+ | 501 | 2619 | 19 |
fiss_sum_wshed |>
  ggplot2::ggplot(ggplot2::aes(x = Watershed, y = Percent)) +
  ggplot2::geom_bar(stat = "identity") +
  ggplot2::facet_wrap(~species_code, ncol = 2) +
  ggplot2::theme_bw(base_size = 11) +
  ggplot2::labs(x = "Watershed Area", y = "Occurrences (%)") +
  ggplot2::theme(axis.text.x = ggplot2::element_text(angle = 45, hjust = 1))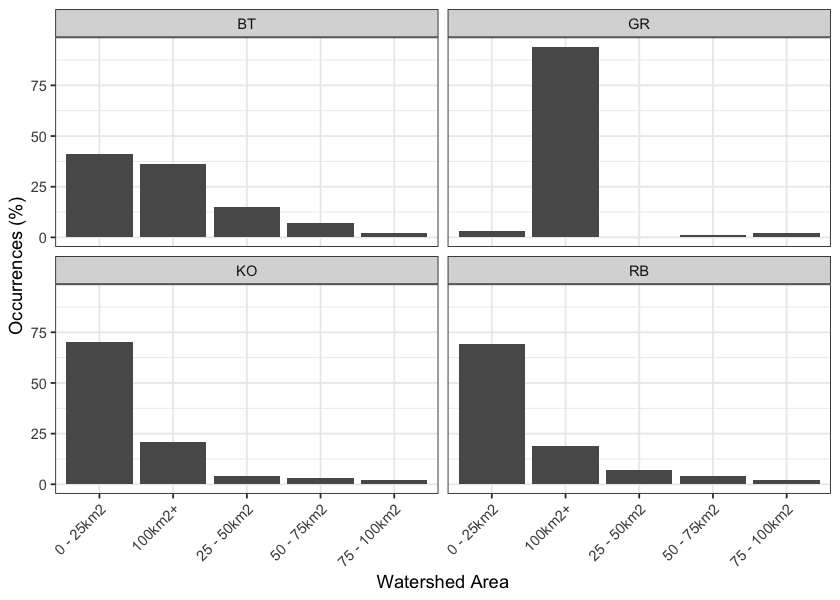
Figure 2.5: Summary of historic fish observations vs. watershed size category for the Carp Lake, Crooked River, Finlay Arm, Finlay River, Firesteel River, Fox River, Ingenika River, Lower Omineca River, Mesilinka River, Nation River, Ospika River, Parsnip Arm, Parsnip River, Peace Arm, Toodoggone River, and Upper Omineca River watershed groups.